In this series: Idaho Chronic Absenteeism 2024-25.
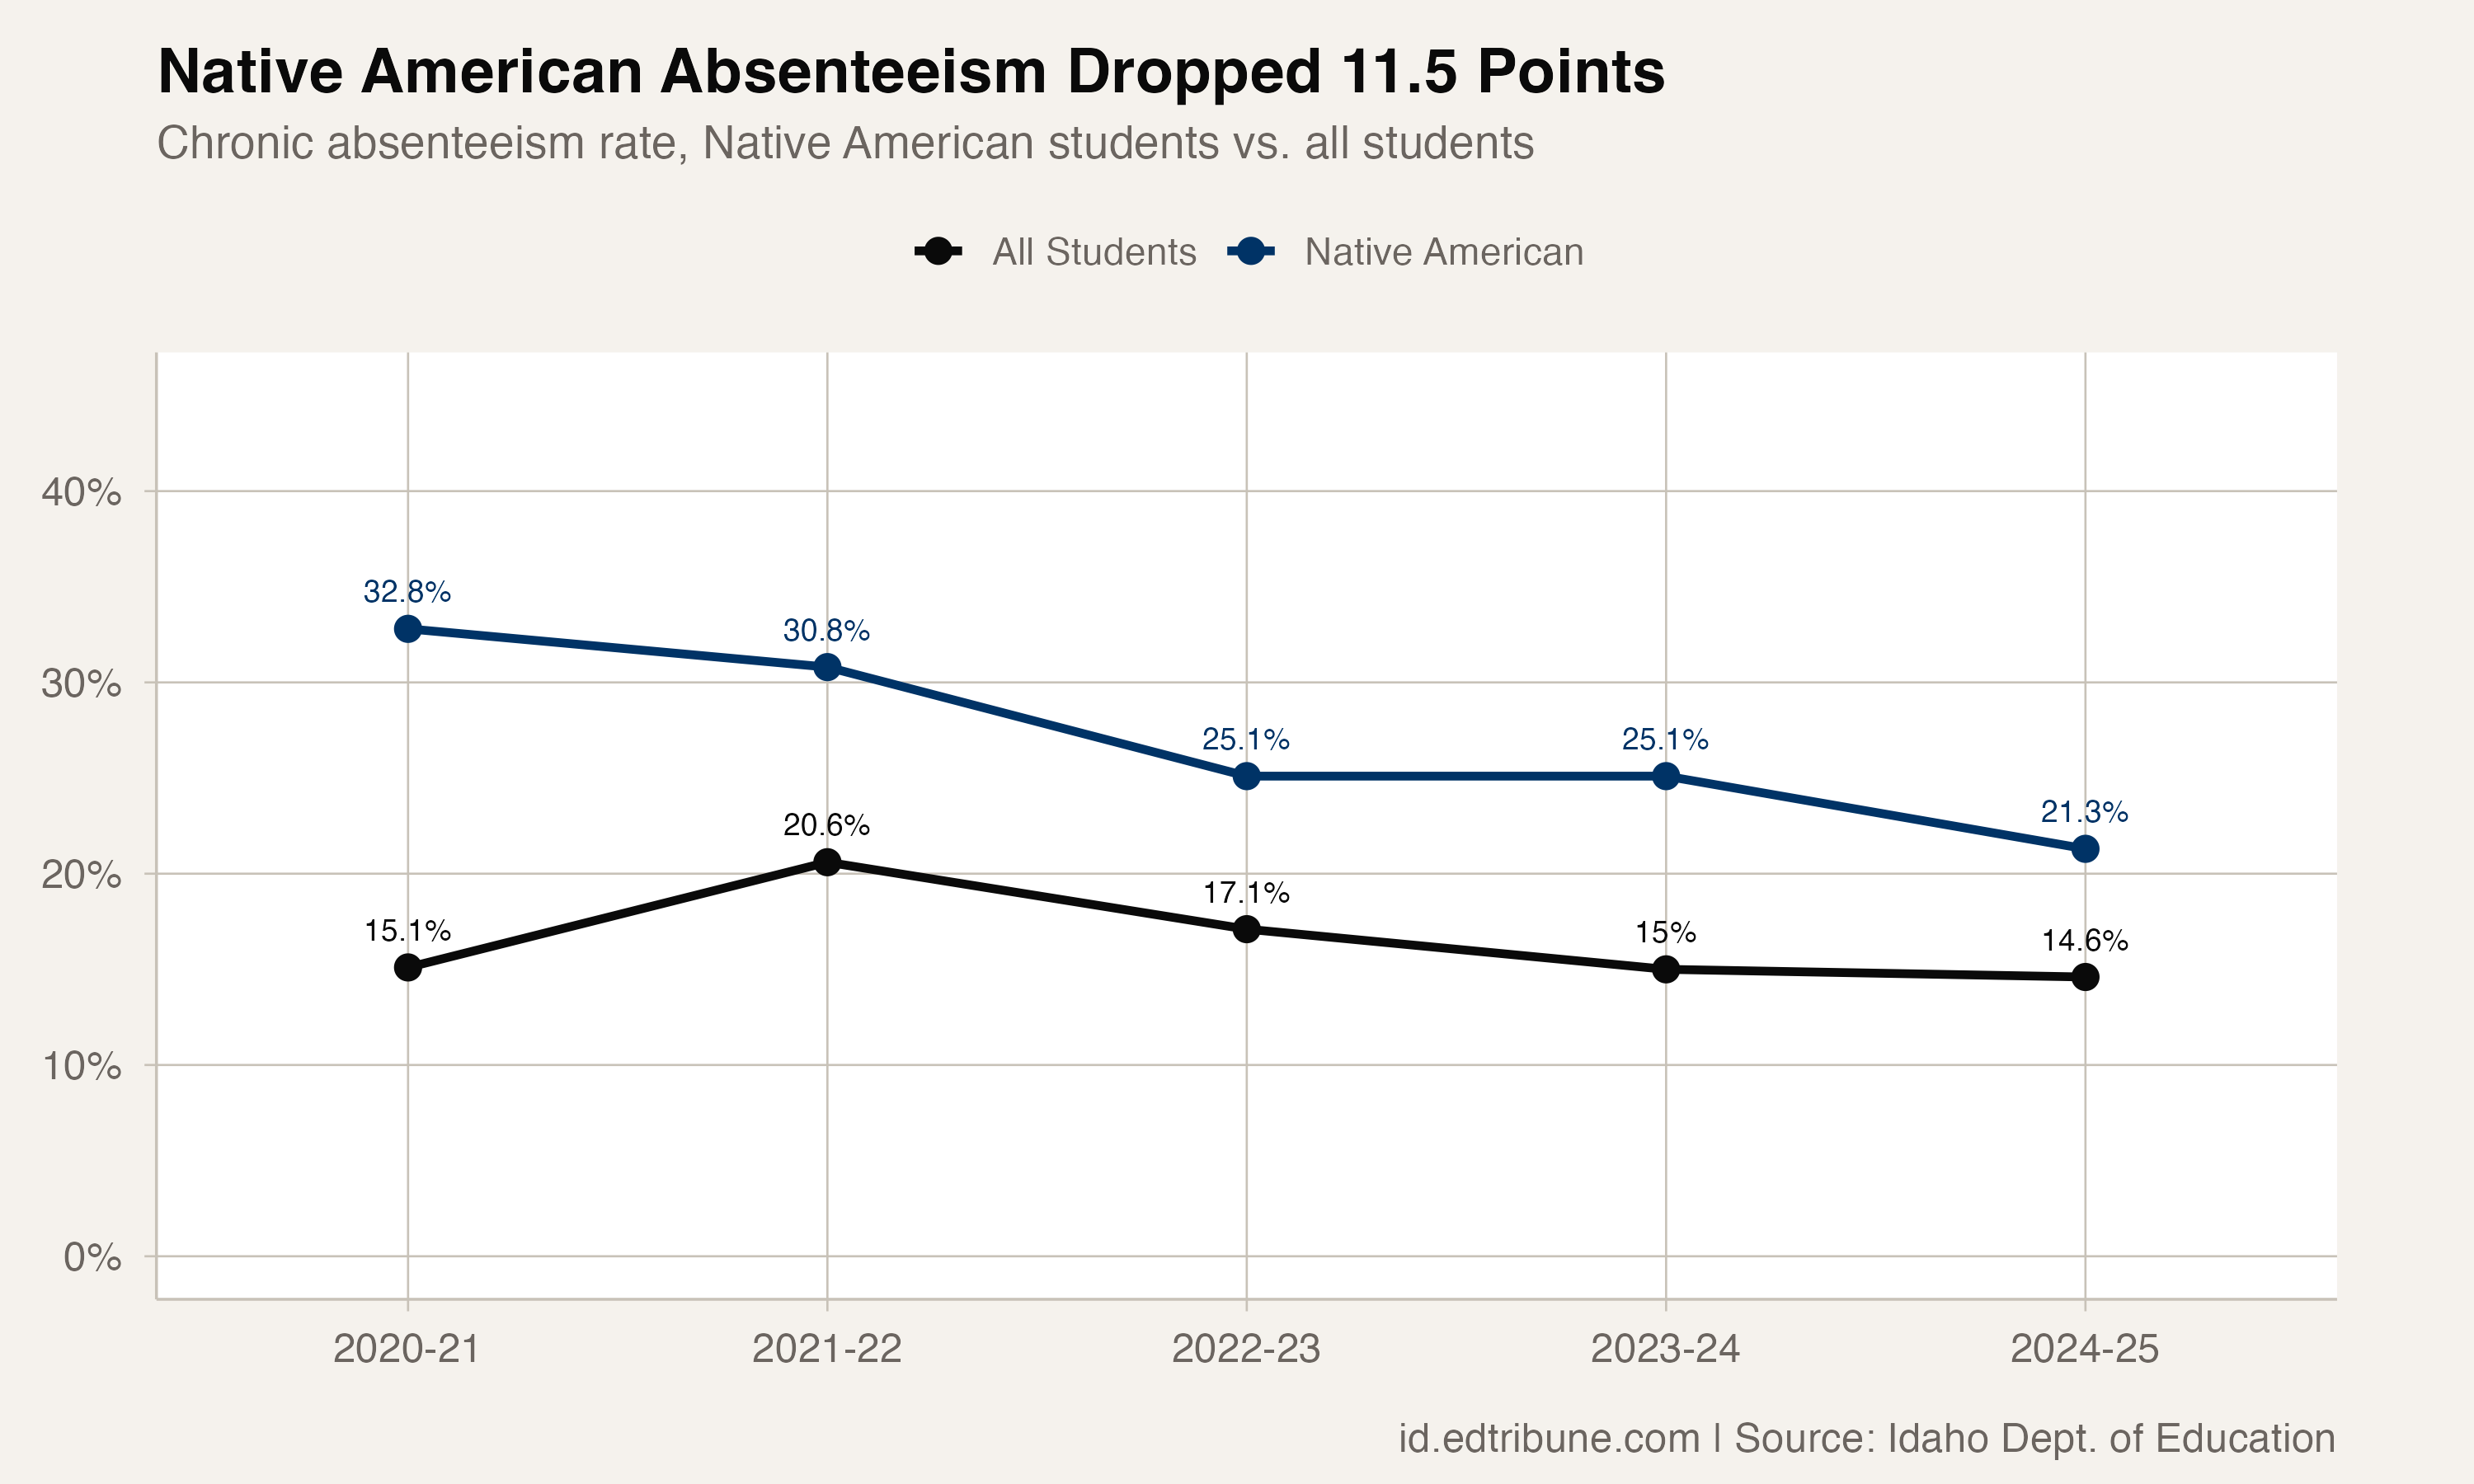
In a state where the overall chronic absenteeism recovery has nearly flatlined, one group stands out: Native American students have cut their chronic absence rate by 11.5 percentage points since 2020-21, the sharpest improvement of any racial or ethnic group in Idaho.
The drop, from 32.8% to 21.3%, has been remarkably steady. While the statewide rate spiked in 2021-22 before falling, Native American students improved every single year: 32.8%, 30.8%, 25.1%, 25.1%, 21.3%. No spike. No backsliding. Just persistent, year-over-year progress.
The gap that was, and the gap that remains
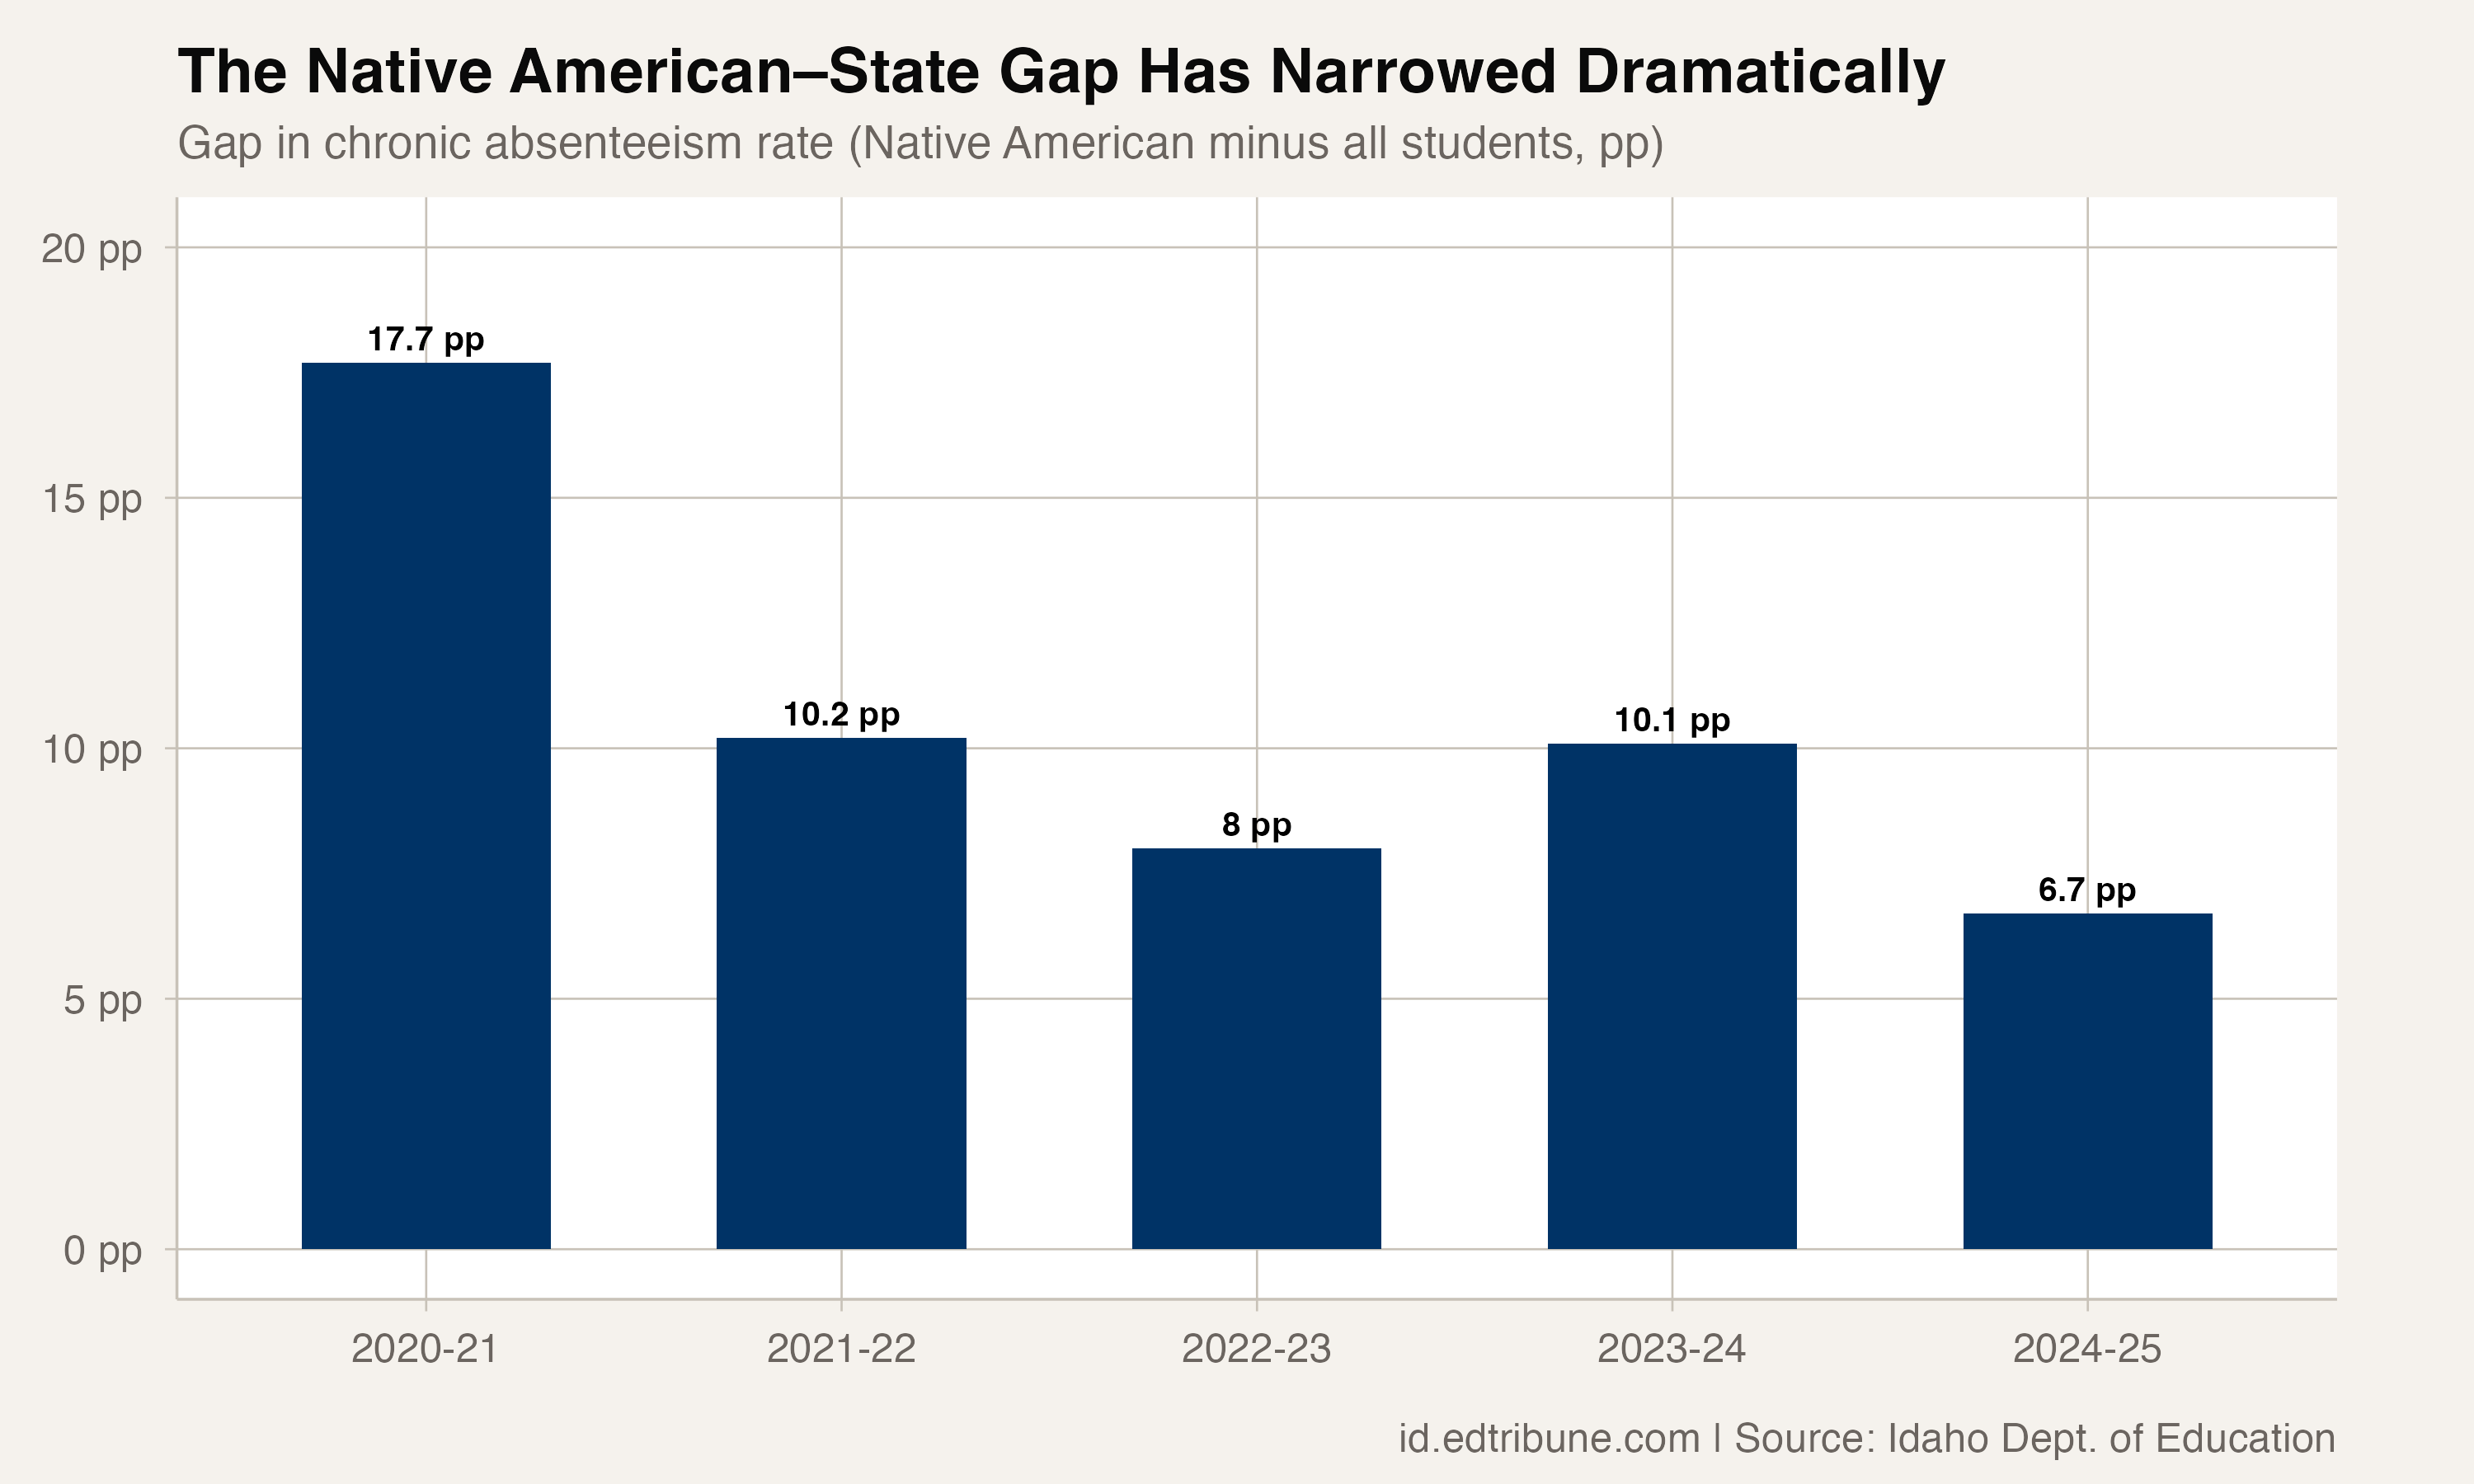
In 2020-21, the chronic absenteeism gap between Native American students and the state average stood at 17.7 percentage points, by far the widest of any racial group. By 2024-25, that gap had shrunk to 6.7 points, a narrowing of 11 points.
But context matters. A 21.3% rate still means more than one in five Native American students is chronically absent. Among Idaho's roughly 3,100 Native American students statewide, that translates to about 660 students missing at least 18 school days per year. The rate remains higher than any other racial group except the small sample of Coeur d'Alene District's 54 Native American students, where the rate hits 44.4%.
How does this compare to other groups?
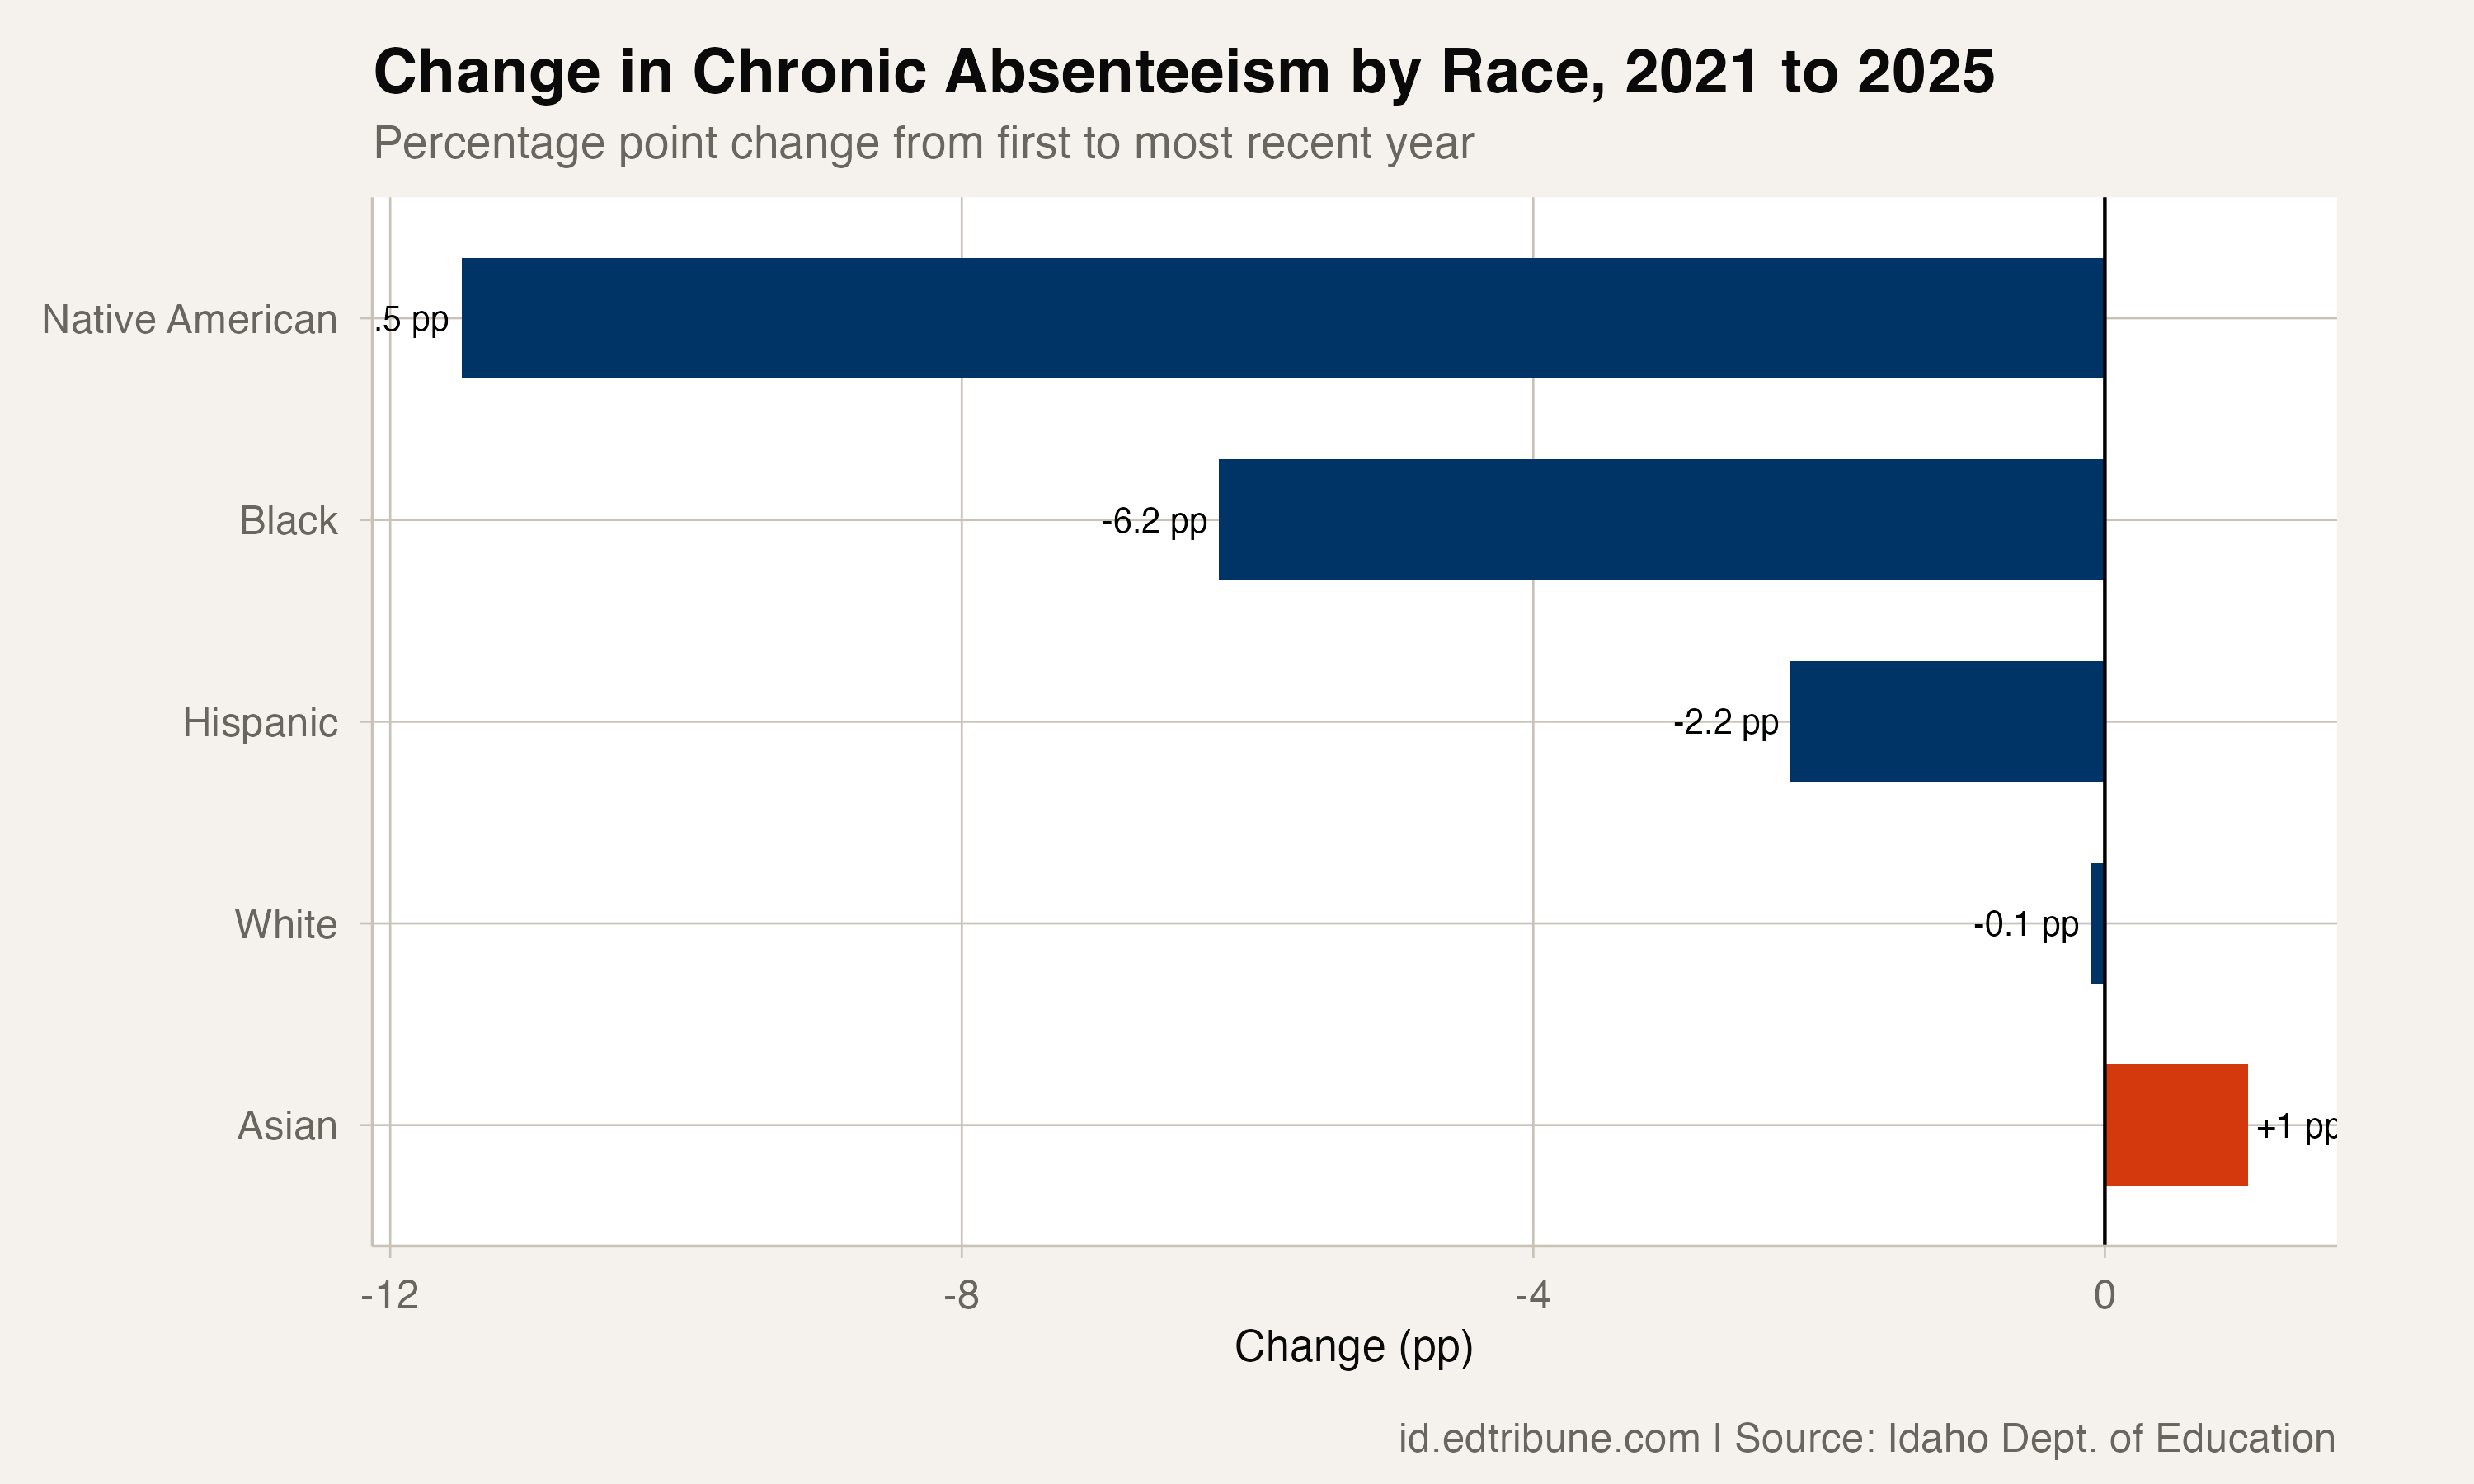
The contrast with other racial groups is stark. Black students improved by 6.2 percentage points, meaningful but roughly half the Native American gain. Hispanic students, Idaho's largest minority group at 62,866 students, improved just 2.2 points to 19.7%. White students, 72% of enrollment, barely moved: 13.0% to 12.9%.
Asian students actually worsened slightly, from 9.2% to 10.2%, though they still have the lowest rate of any group. The overall state rate fell just 0.5 points.
What might be driving this
The Nez Perce Tribe's Supporting Transitions for the Education Pipeline (STEP) program, centered in Lapwai, has focused on culturally responsive family engagement and addressing the transportation barriers that keep rural students home. In Lapwai District↗ET (74% Native American, situated on the Nez Perce Reservation) the chronic rate remains high at 39.4%, but the trajectory has been volatile: it peaked at 48.8% in 2022, fell to 34.4% in 2024, then rebounded to 39.4%.
The broader statewide improvement suggests something beyond any single program is at work. Blackfoot District, which has 587 Native American students, posted a 17.0% chronic rate, well below the statewide Native American average and not far from the overall state rate. The Idaho State Department of Education's Indian Education coordinator has been working with tribal education departments across the state, though the agency has not publicly credited specific interventions for the improvement.
One caution: with roughly 3,100 Native American students statewide, the aggregate rate is more volatile than for larger groups. A shift of 350 students from chronically absent to regularly attending would move the rate by roughly 11 points, about the magnitude of the observed change. That does not make the improvement illusory, but it means a bad flu season or a single district's reporting change could shift the number meaningfully.
The districts where the rate remains high
Lapwai's 39.4% rate is the most visible challenge, but even Boise Independent District, Idaho's largest, has a 37.5% chronic rate among its 88 Native American students. Pocatello District shows 23.7% for its 393 Native American students. These district-level numbers suggest the statewide improvement may be uneven, concentrated in some communities while others remain stuck.
The improvement is real and worth understanding. But at 21.3%, the work is not finished. And with roughly 3,100 Native American students statewide, the entire 11.5-point improvement could be explained by about 350 students shifting from chronically absent to regularly attending. That does not make it illusory. The consistency across five years argues against a fluke. It does mean the progress is more fragile than the trendline suggests.
Detailed code that reproduces the analysis and figures in this article is available exclusively to EdTribune subscribers.
Discussion
Sign in to join the discussion.
Loading comments...