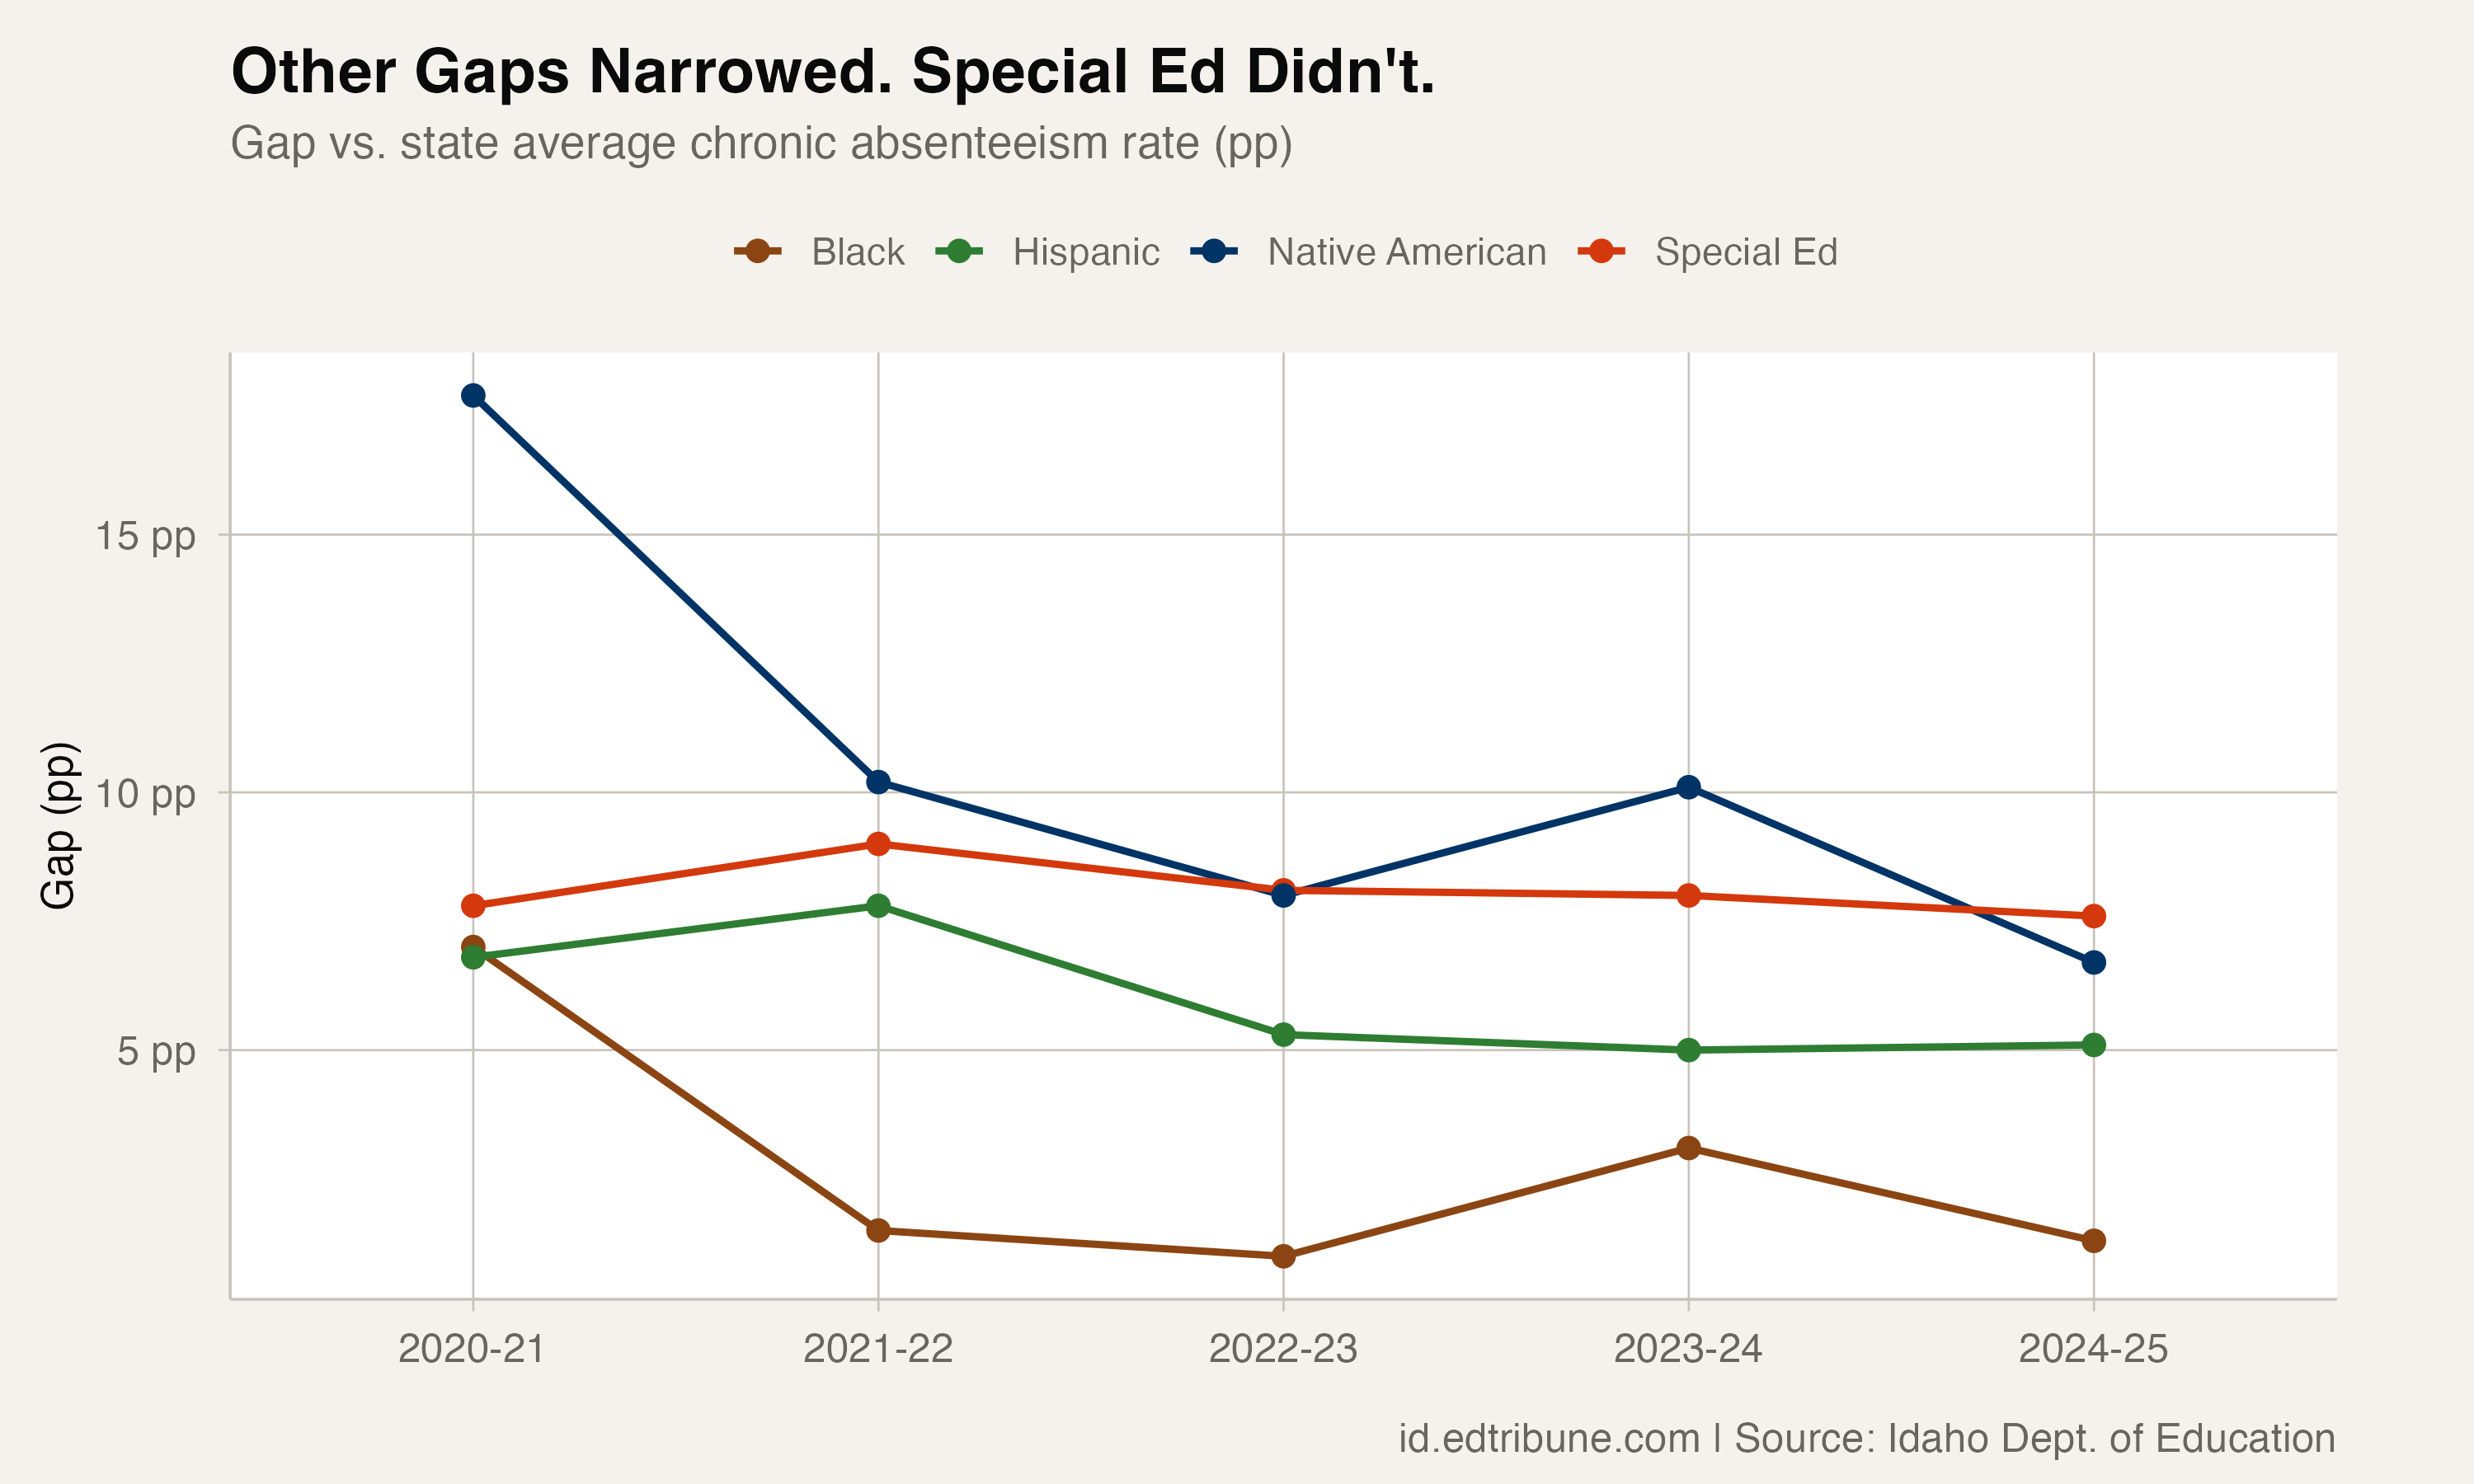
Idaho has made real progress closing some of its chronic absenteeism gaps. The Native American-state gap shrank by 11 points. The Black-state gap fell from 7 to 1.3 points. But one gap has been stubbornly, almost eerily stable: the gap between students with disabilities and everyone else.
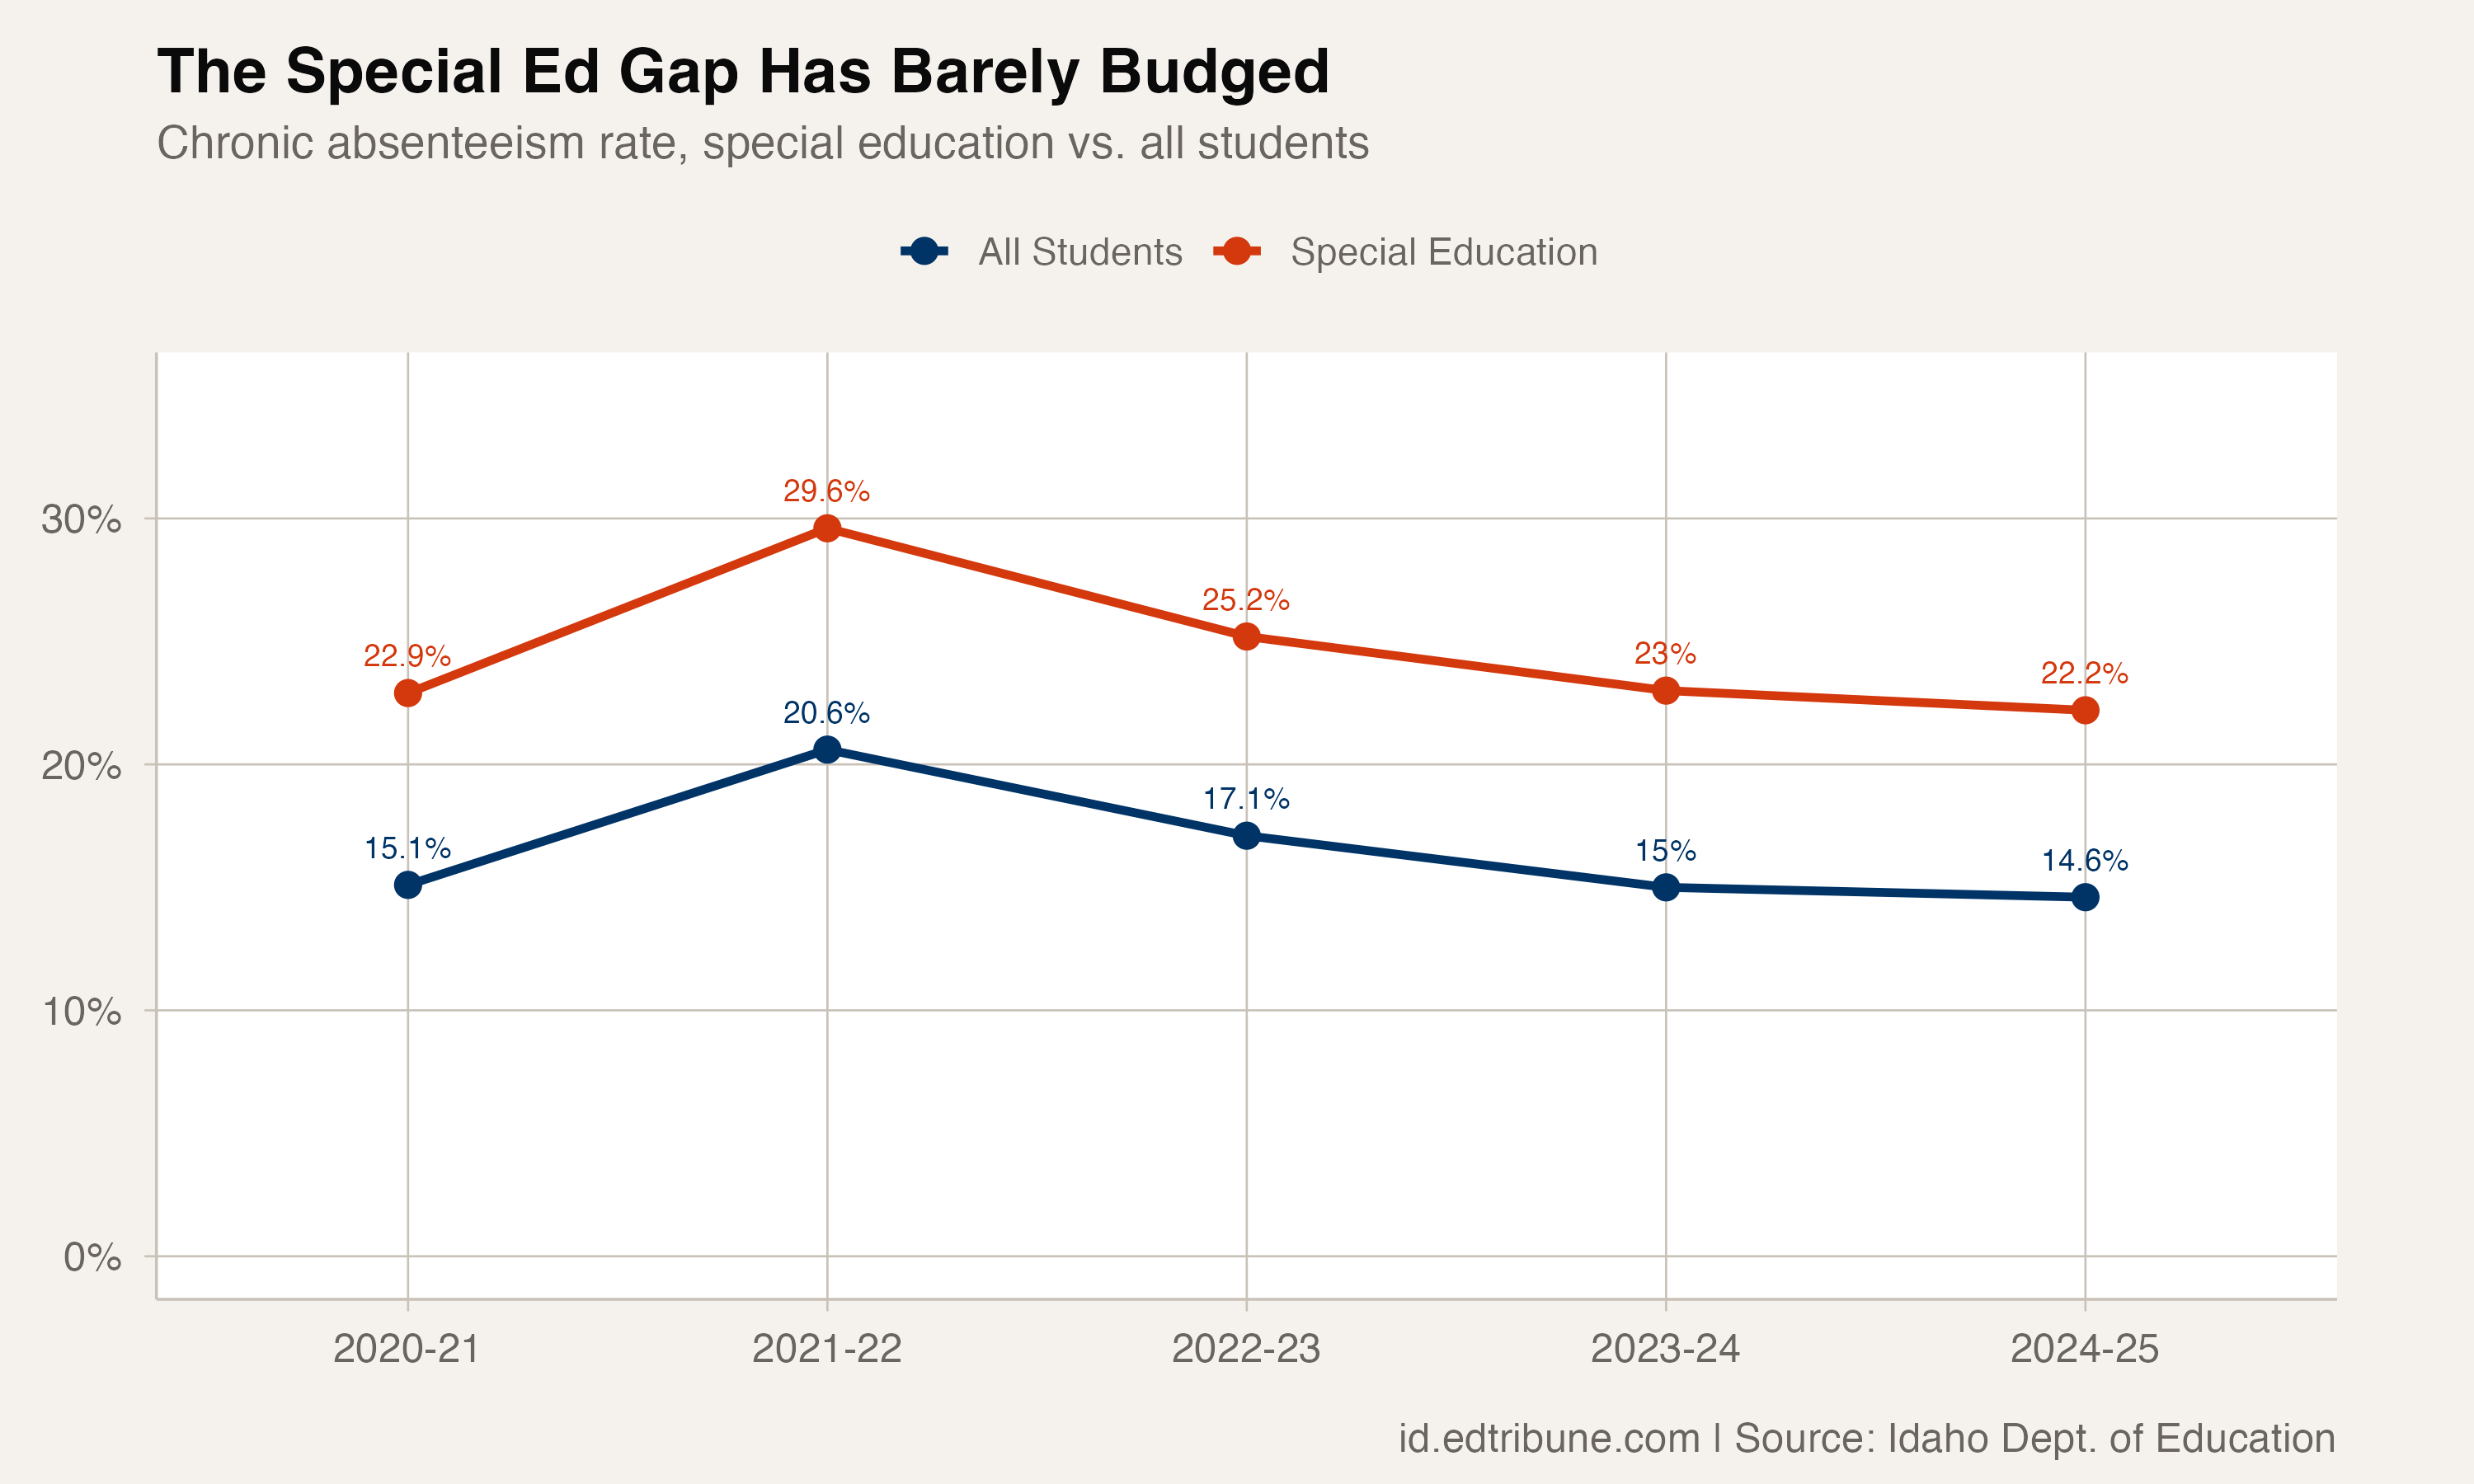
In 2020-21, students receiving special education services had a chronic absenteeism rate 7.8 percentage points higher than the state average. In 2024-25, the gap is 7.6 points. In between, it reached 9.0 points during the pandemic peak and 8.0 or 8.1 in every other year. The line does not really bend.
A gap that survived the pandemic
What makes the special education gap distinctive is its behavior during the pandemic cycle. When COVID drove absenteeism up for everyone in 2021-22, the rate for students with disabilities rose in near-lockstep, from 22.9% to 29.6%, maintaining the same approximate distance above the overall rate. When the state improved, these students improved at roughly the same pace. The gap neither widened dramatically during the crisis nor narrowed during the recovery.
This is a fundamentally different pattern from the racial equity gaps. The Native American gap dropped from 17.7 points to 6.7. The Black gap fell from 7.0 to 1.3. The Hispanic gap narrowed from 6.8 to 5.1. Each of these groups had pandemic-specific barriers that, once addressed, allowed faster recovery than the overall population.
Students with disabilities, by contrast, face attendance barriers that are structural and ongoing: medical appointments related to disability, sensory or behavioral challenges that make school environments difficult, transportation logistics for specialized placements, and in some cases, parental resistance to school attendance when a child's needs feel unmet.
What 22.2% means
Idaho serves about 38,600 students through special education statewide. At a 22.2% chronic rate, roughly 8,600 are missing at least 18 days of school per year. That is 1.52 times the rate for the general population. It is not the widest gap among subgroups (students who are currently homeless face a 16-point gap, students in foster care a 12.5-point gap), but it is arguably the most persistent.
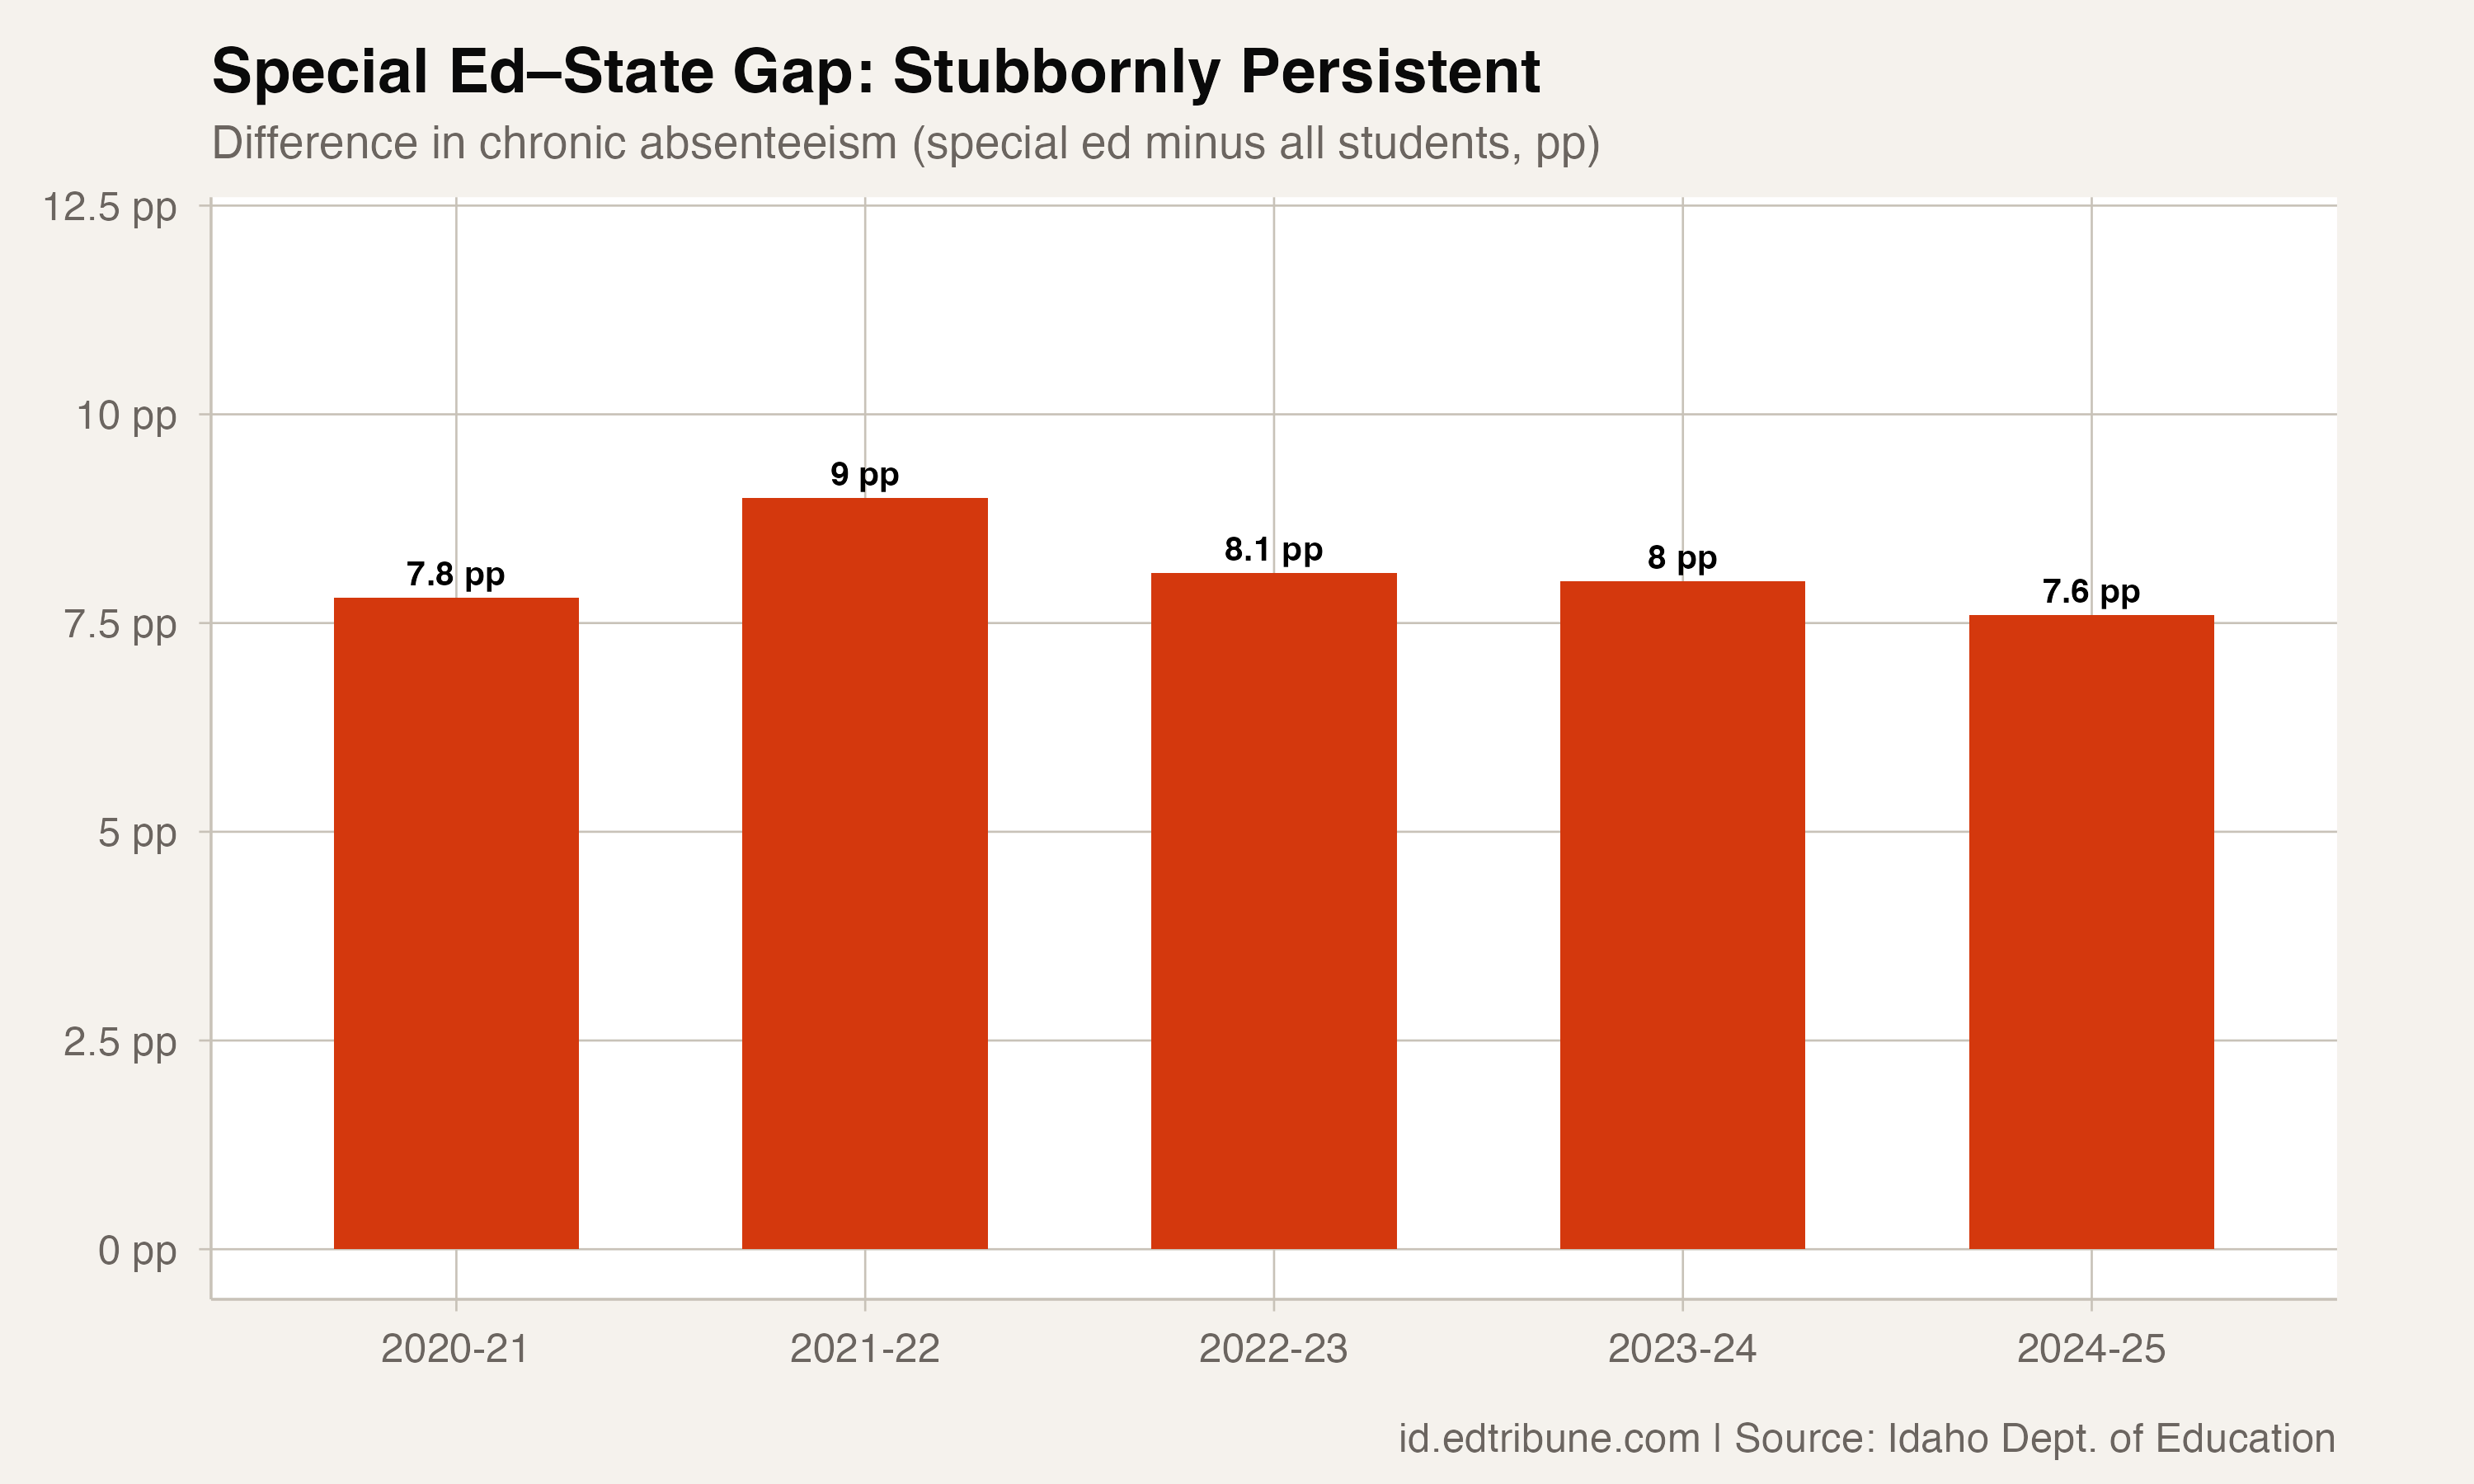
The consistency across five years is the tell. A gap that fluctuates suggests situational factors. A gap that holds within a 1.4-point band (7.6 to 9.0) across a pandemic, a recovery, and a plateau suggests something embedded in the system itself.
The IEP connection
Students with Individualized Education Programs (IEPs) often have legitimate medical or therapeutic reasons for school absences, including specialist appointments, therapeutic services, and health episodes that require time away from school. Idaho, like most states, counts these absences the same as any other.
The Idaho Parents Unlimited advocacy group has raised concerns about whether the chronic absenteeism metric adequately accounts for disability-related absences, arguing that a blanket 10% threshold may unfairly flag students whose absences are medically necessary and documented in their IEPs.
This does not make the absences less consequential for learning. A student who misses 18 days for therapy appointments loses the same instructional time as a student who misses 18 days for any other reason. But it does complicate the intervention question: the "fix" for special education absenteeism may look very different from attendance campaigns or truancy enforcement.
A problem that intervention campaigns don't reach
The statewide attendance awareness campaigns and "Every Day Matters" initiatives that helped drive Idaho's overall improvement from 20.6% to 14.6% appear to have had proportionally similar effects for students with disabilities, reducing their rate from 29.6% to 22.2%. But the gap remained because the interventions addressed pandemic-specific barriers (fear of illness, disrupted routines, weakened school connection) rather than the structural barriers specific to disability and special education.
Closing the special education gap would likely require a different set of tools: telehealth options that reduce medical-related absences, better coordination between therapeutic services and school schedules, more robust homebound instruction when physical attendance is impossible, and school environments better designed to accommodate sensory and behavioral needs.
Until those structural changes happen, the data suggests the 7-to-8-point gap will persist, a fixture of Idaho's attendance landscape that the pandemic neither created nor disrupted.
Detailed code that reproduces the analysis and figures in this article is available exclusively to EdTribune subscribers.
Discussion
Sign in to join the discussion.
Loading comments...