In 2001-02, for every 100 Idaho 9th graders, roughly 12 never showed up as seniors three years later. By 2025-26, that number had dropped to fewer than four.
Idaho's 9th-to-12th grade cohort survival rate climbed from 87.7% for the class entering high school in 2001-02 to 96.5% for the class entering in 2022-23, an improvement of 8.8 percentage points over 21 cohorts. The state's 2025-26 senior class of 25,316 is the largest on record, and for the first time in the dataset, 12th grade enrollment exceeded 11th grade enrollment in the same year.
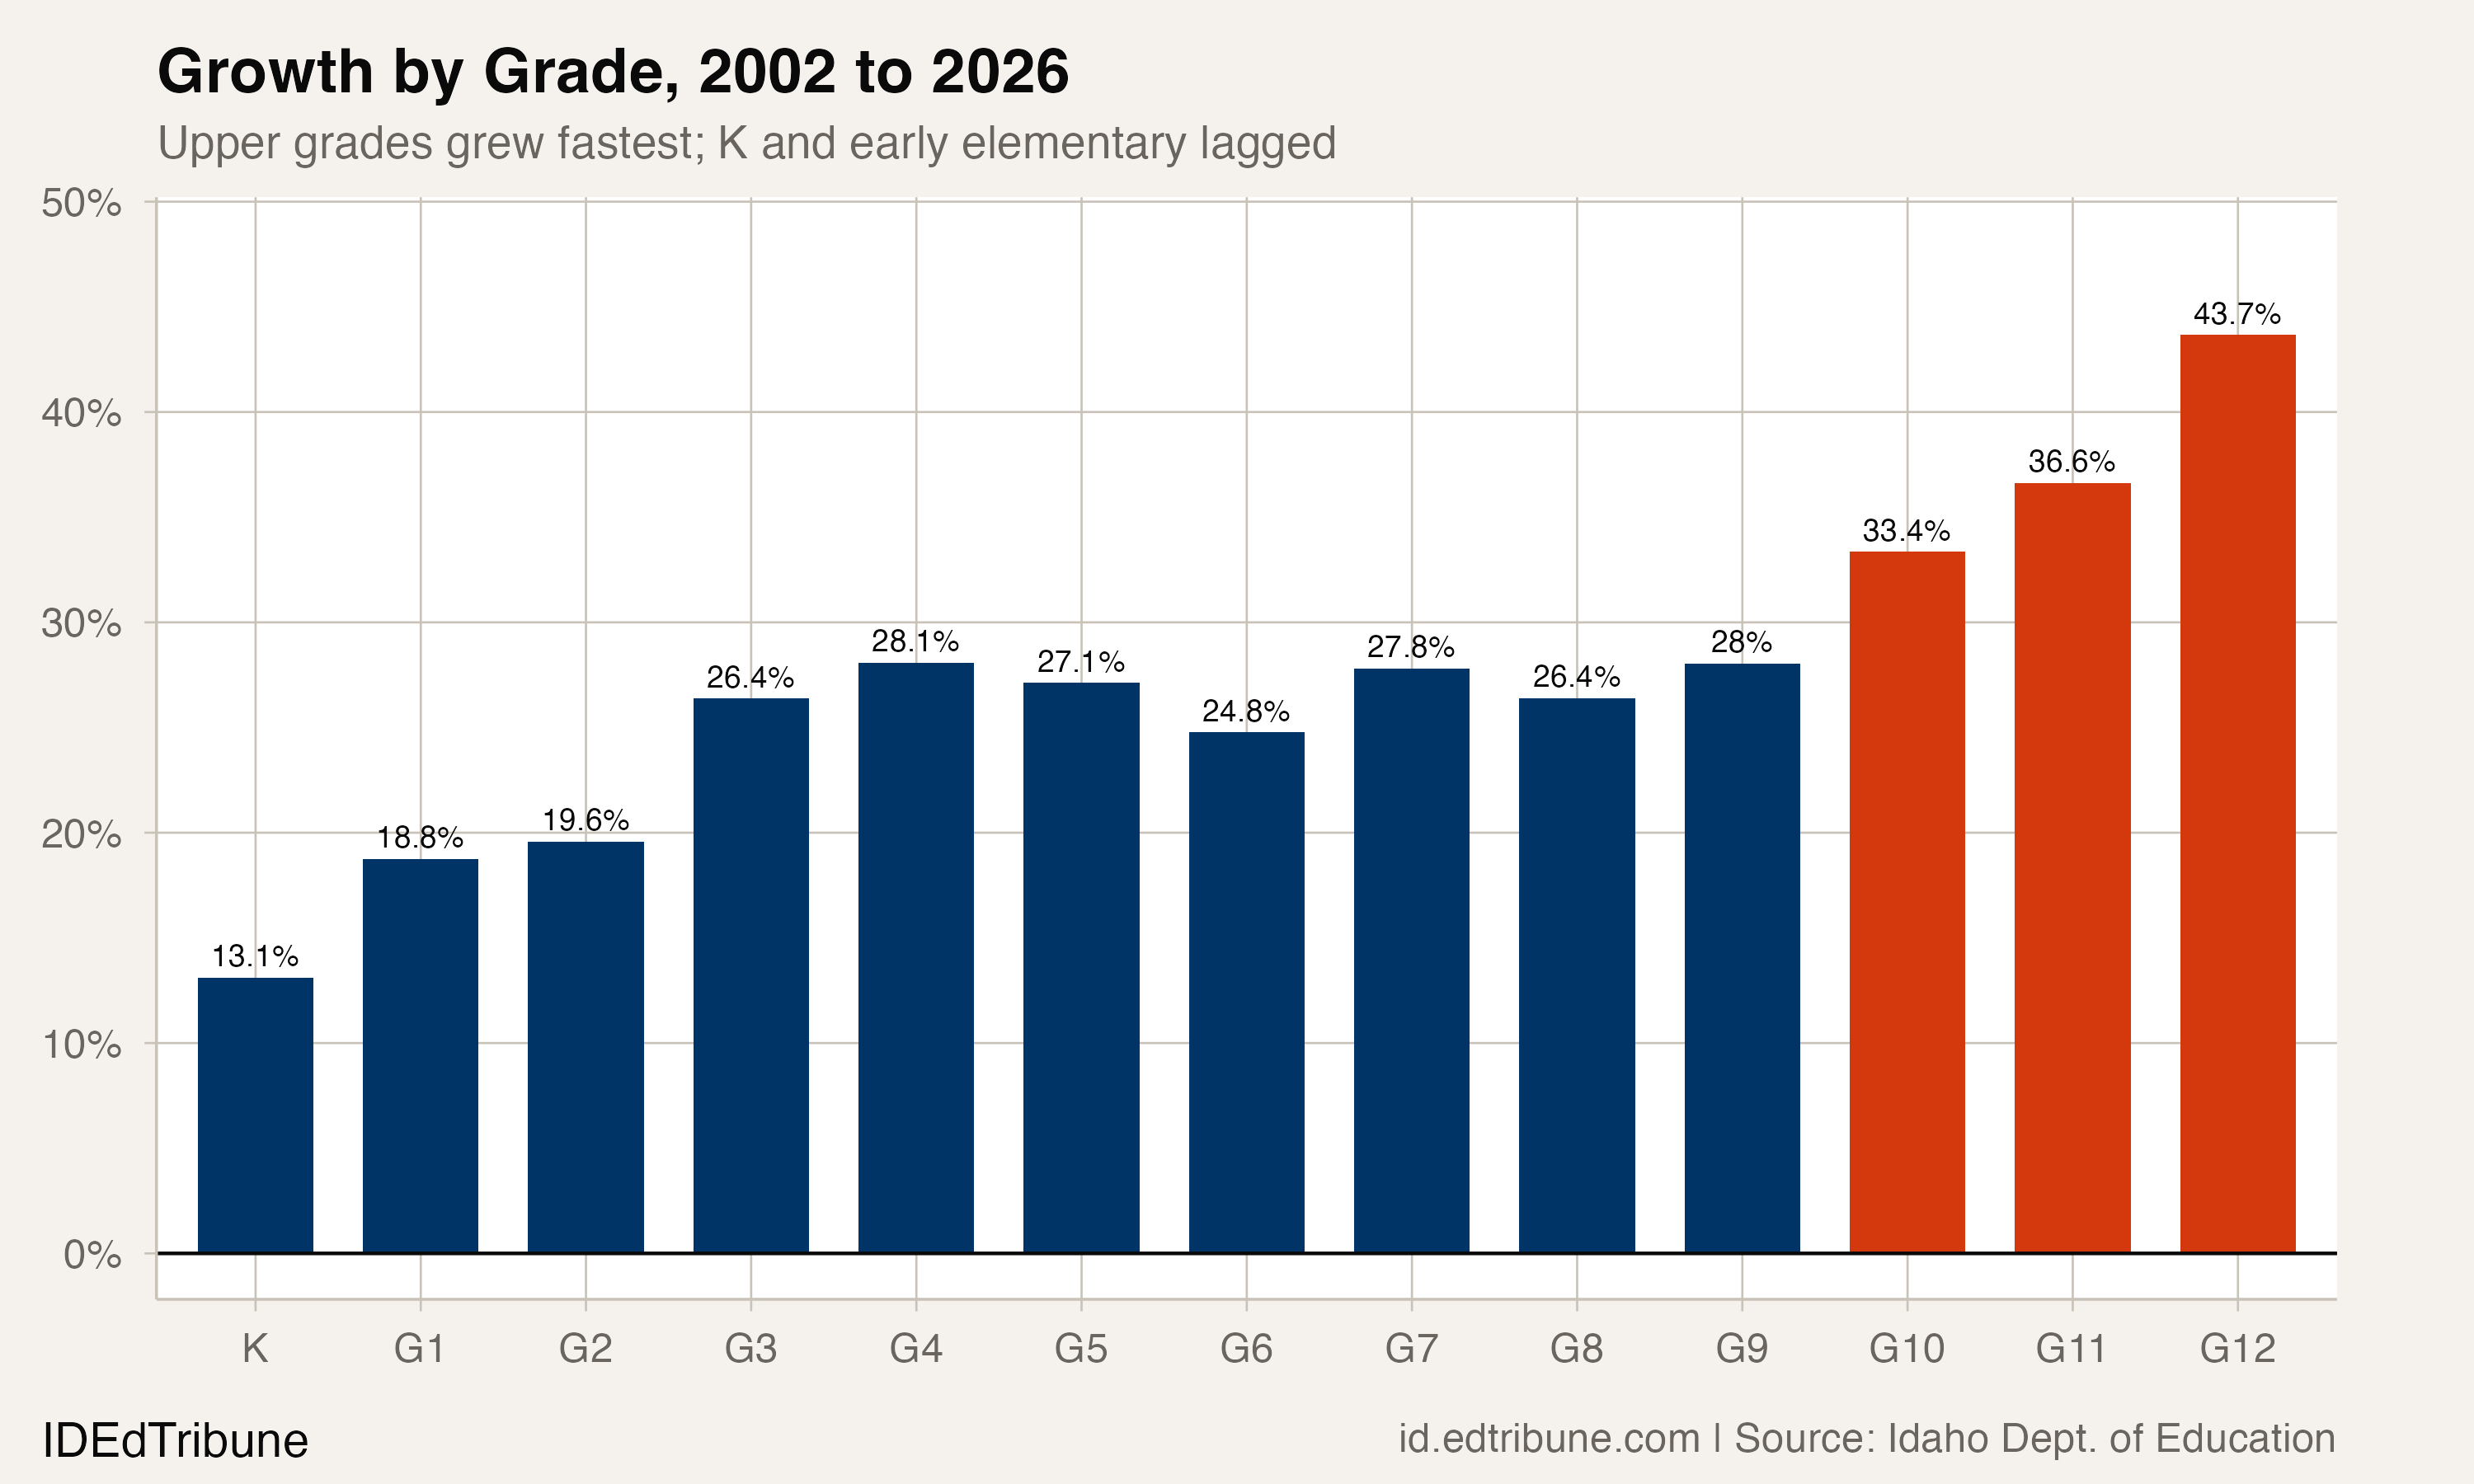
This is not simply a story about more students. Idaho's total K-12 enrollment peaked at 318,979 in 2022-23 and has since declined to 314,097. The pipeline is getting smaller at the bottom and fuller at the top: kindergarten grew 13.1% since 2001-02 while 12th grade grew 43.7%. Something is keeping students in school who, a generation ago, would have disappeared from the rolls.
The 9th grade bottleneck that isn't
The most visible improvement is at the transition point where students historically fell out.
The "9th grade bump" measures how many more 9th graders appear each fall than the prior year's 8th grade class. That excess primarily reflects students repeating 9th grade after failing, though it also captures transfers from private schools and homeschool. In the early 2000s, the bump added 5% to 7% more students to Idaho's freshman class than the feeder cohort warranted. The bump peaked at 6.8% for the 2004-05 eighth grade cohort, meaning for every 100 students who finished 8th grade that year, roughly 107 showed up in 9th grade the following fall.
By 2021-22, that figure had fallen to 1.7%. Recent years have stabilized around 1.9% to 2.0%, a level more consistent with normal transfers and boundary changes than with mass retention.
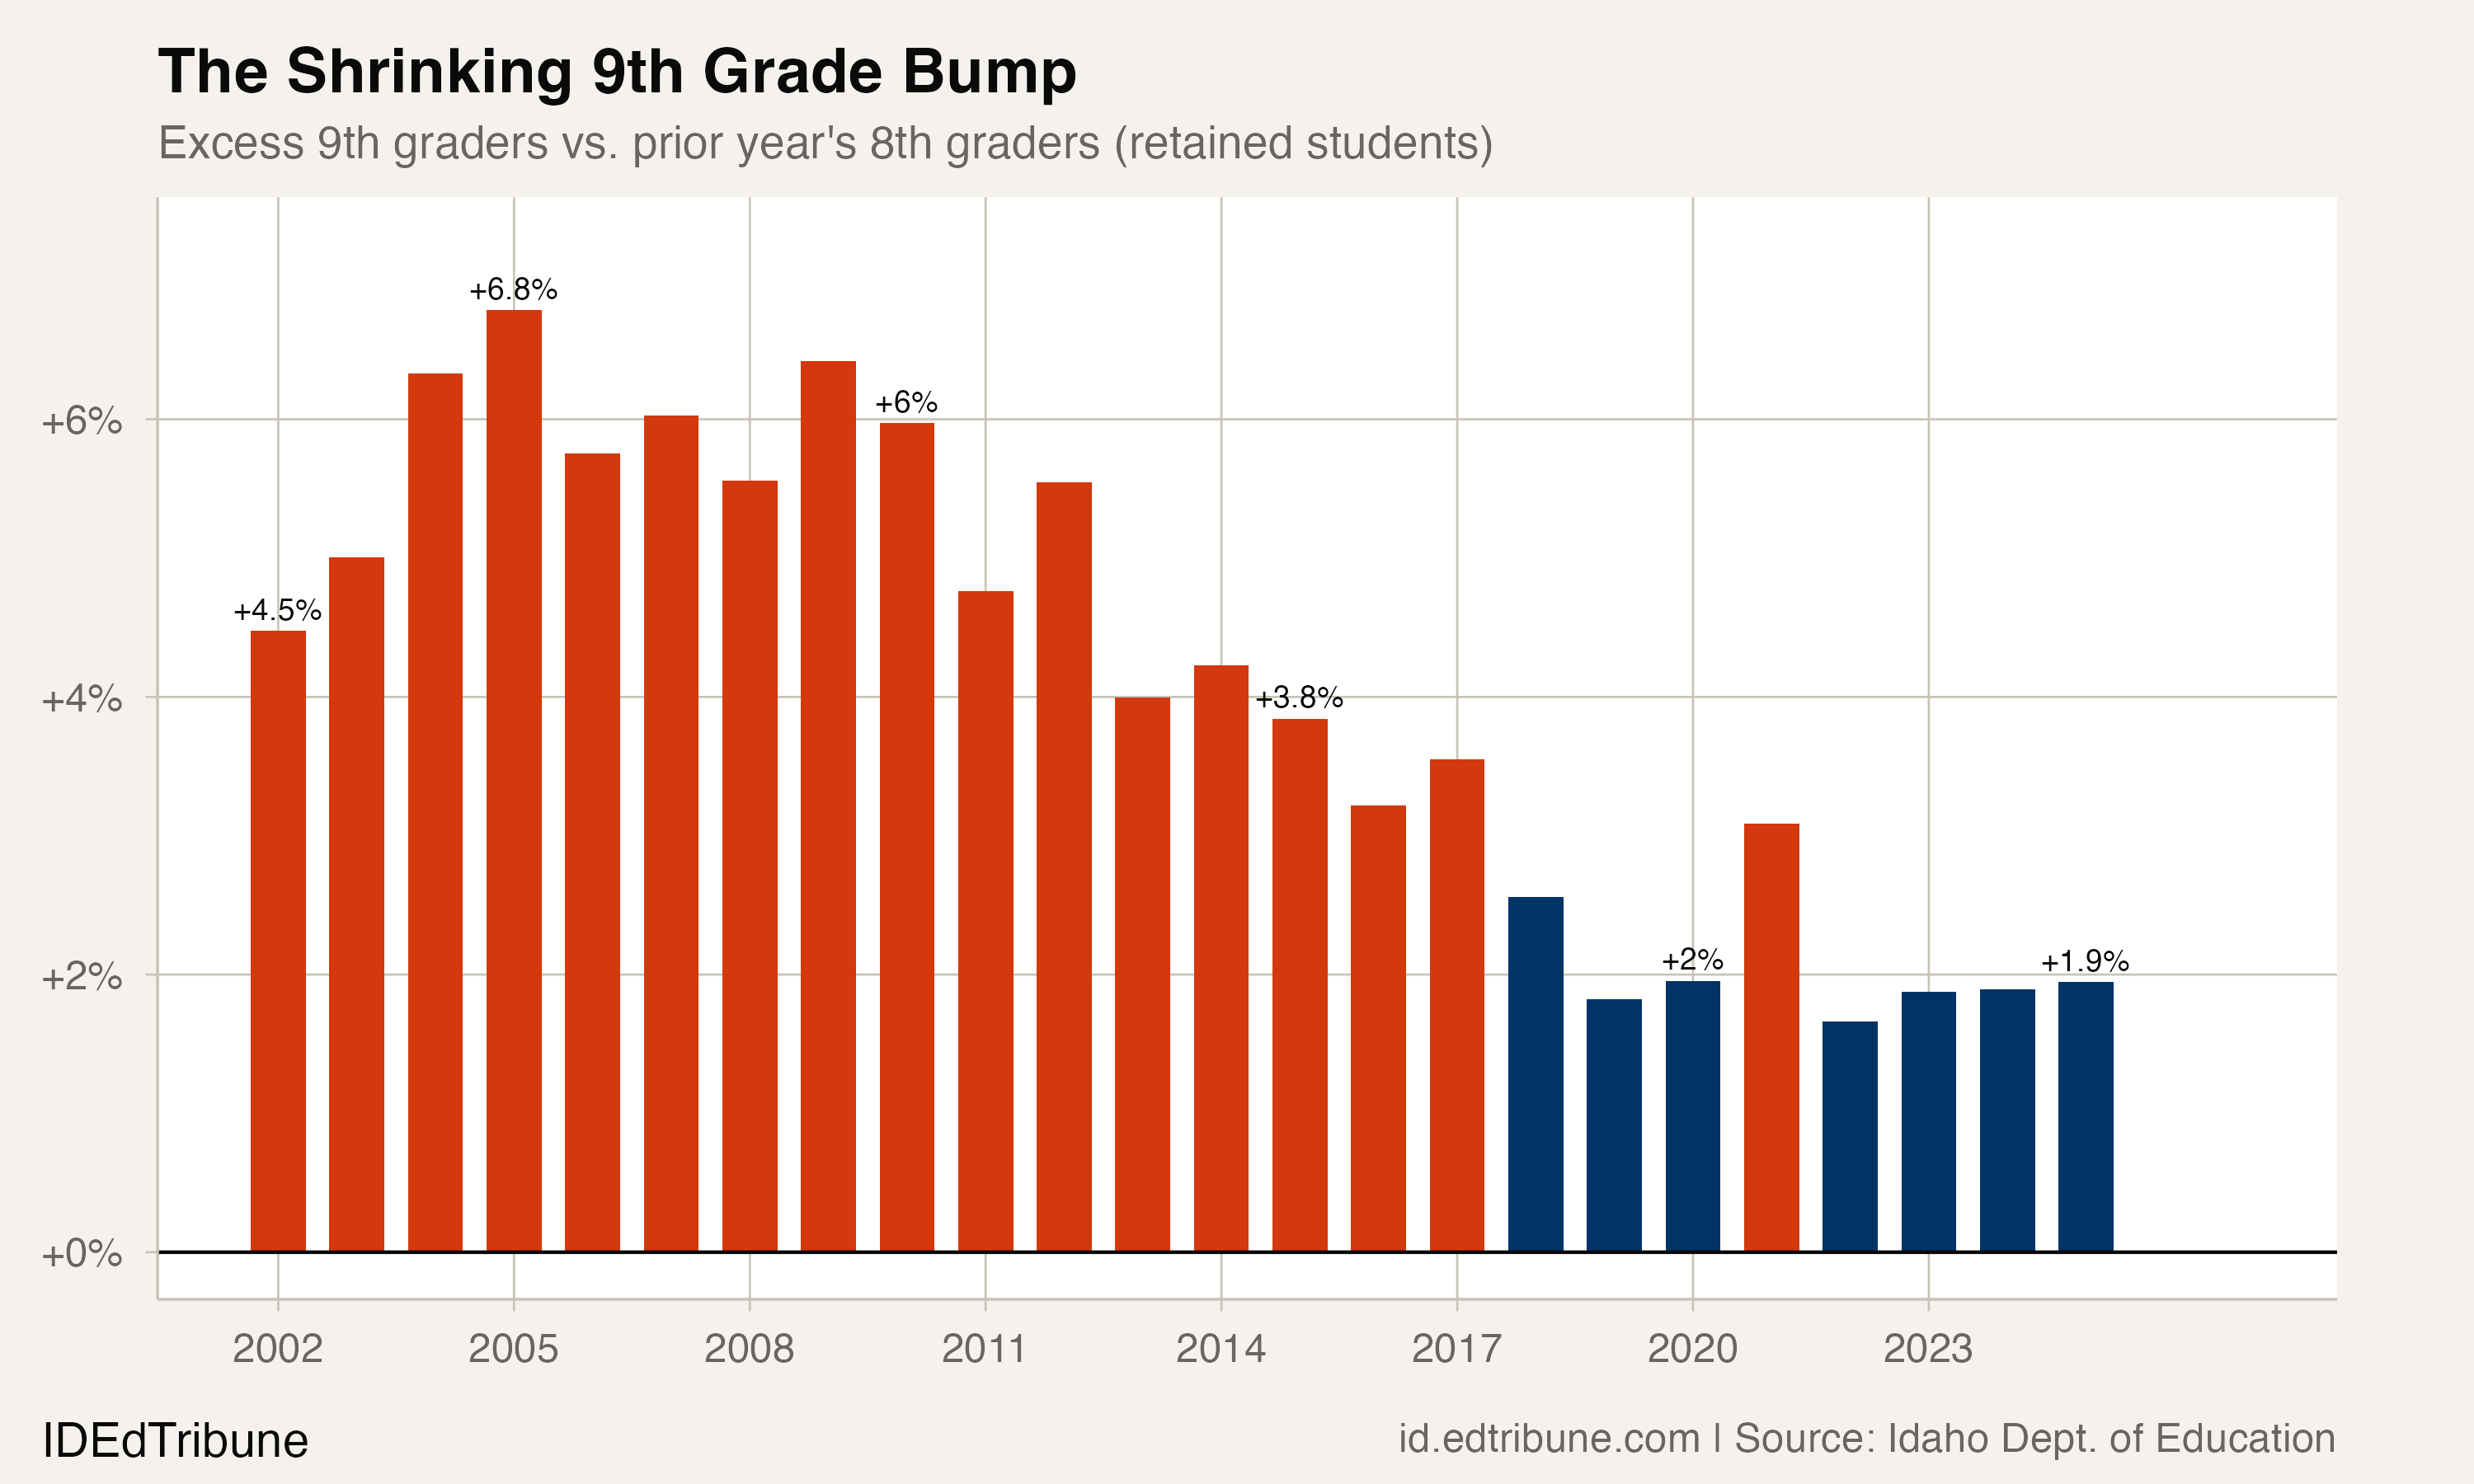
The collapse of the 9th grade bump matters because retained freshmen were historically the students most likely to drop out. A student repeating 9th grade is already a year behind, disengaged, and often 16 by the time they would enter 10th grade. Fewer retained freshmen means fewer students reaching the legal dropout age while still classified as freshmen.
Riding the pipeline to 12th grade
The survival rate improvement is not confined to a single transition. At the other end of high school, the 11th-to-12th attrition rate, which measures students who vanish between junior and senior year, dropped from 5.1% in 2002-03 to 2.0% in 2025-26.
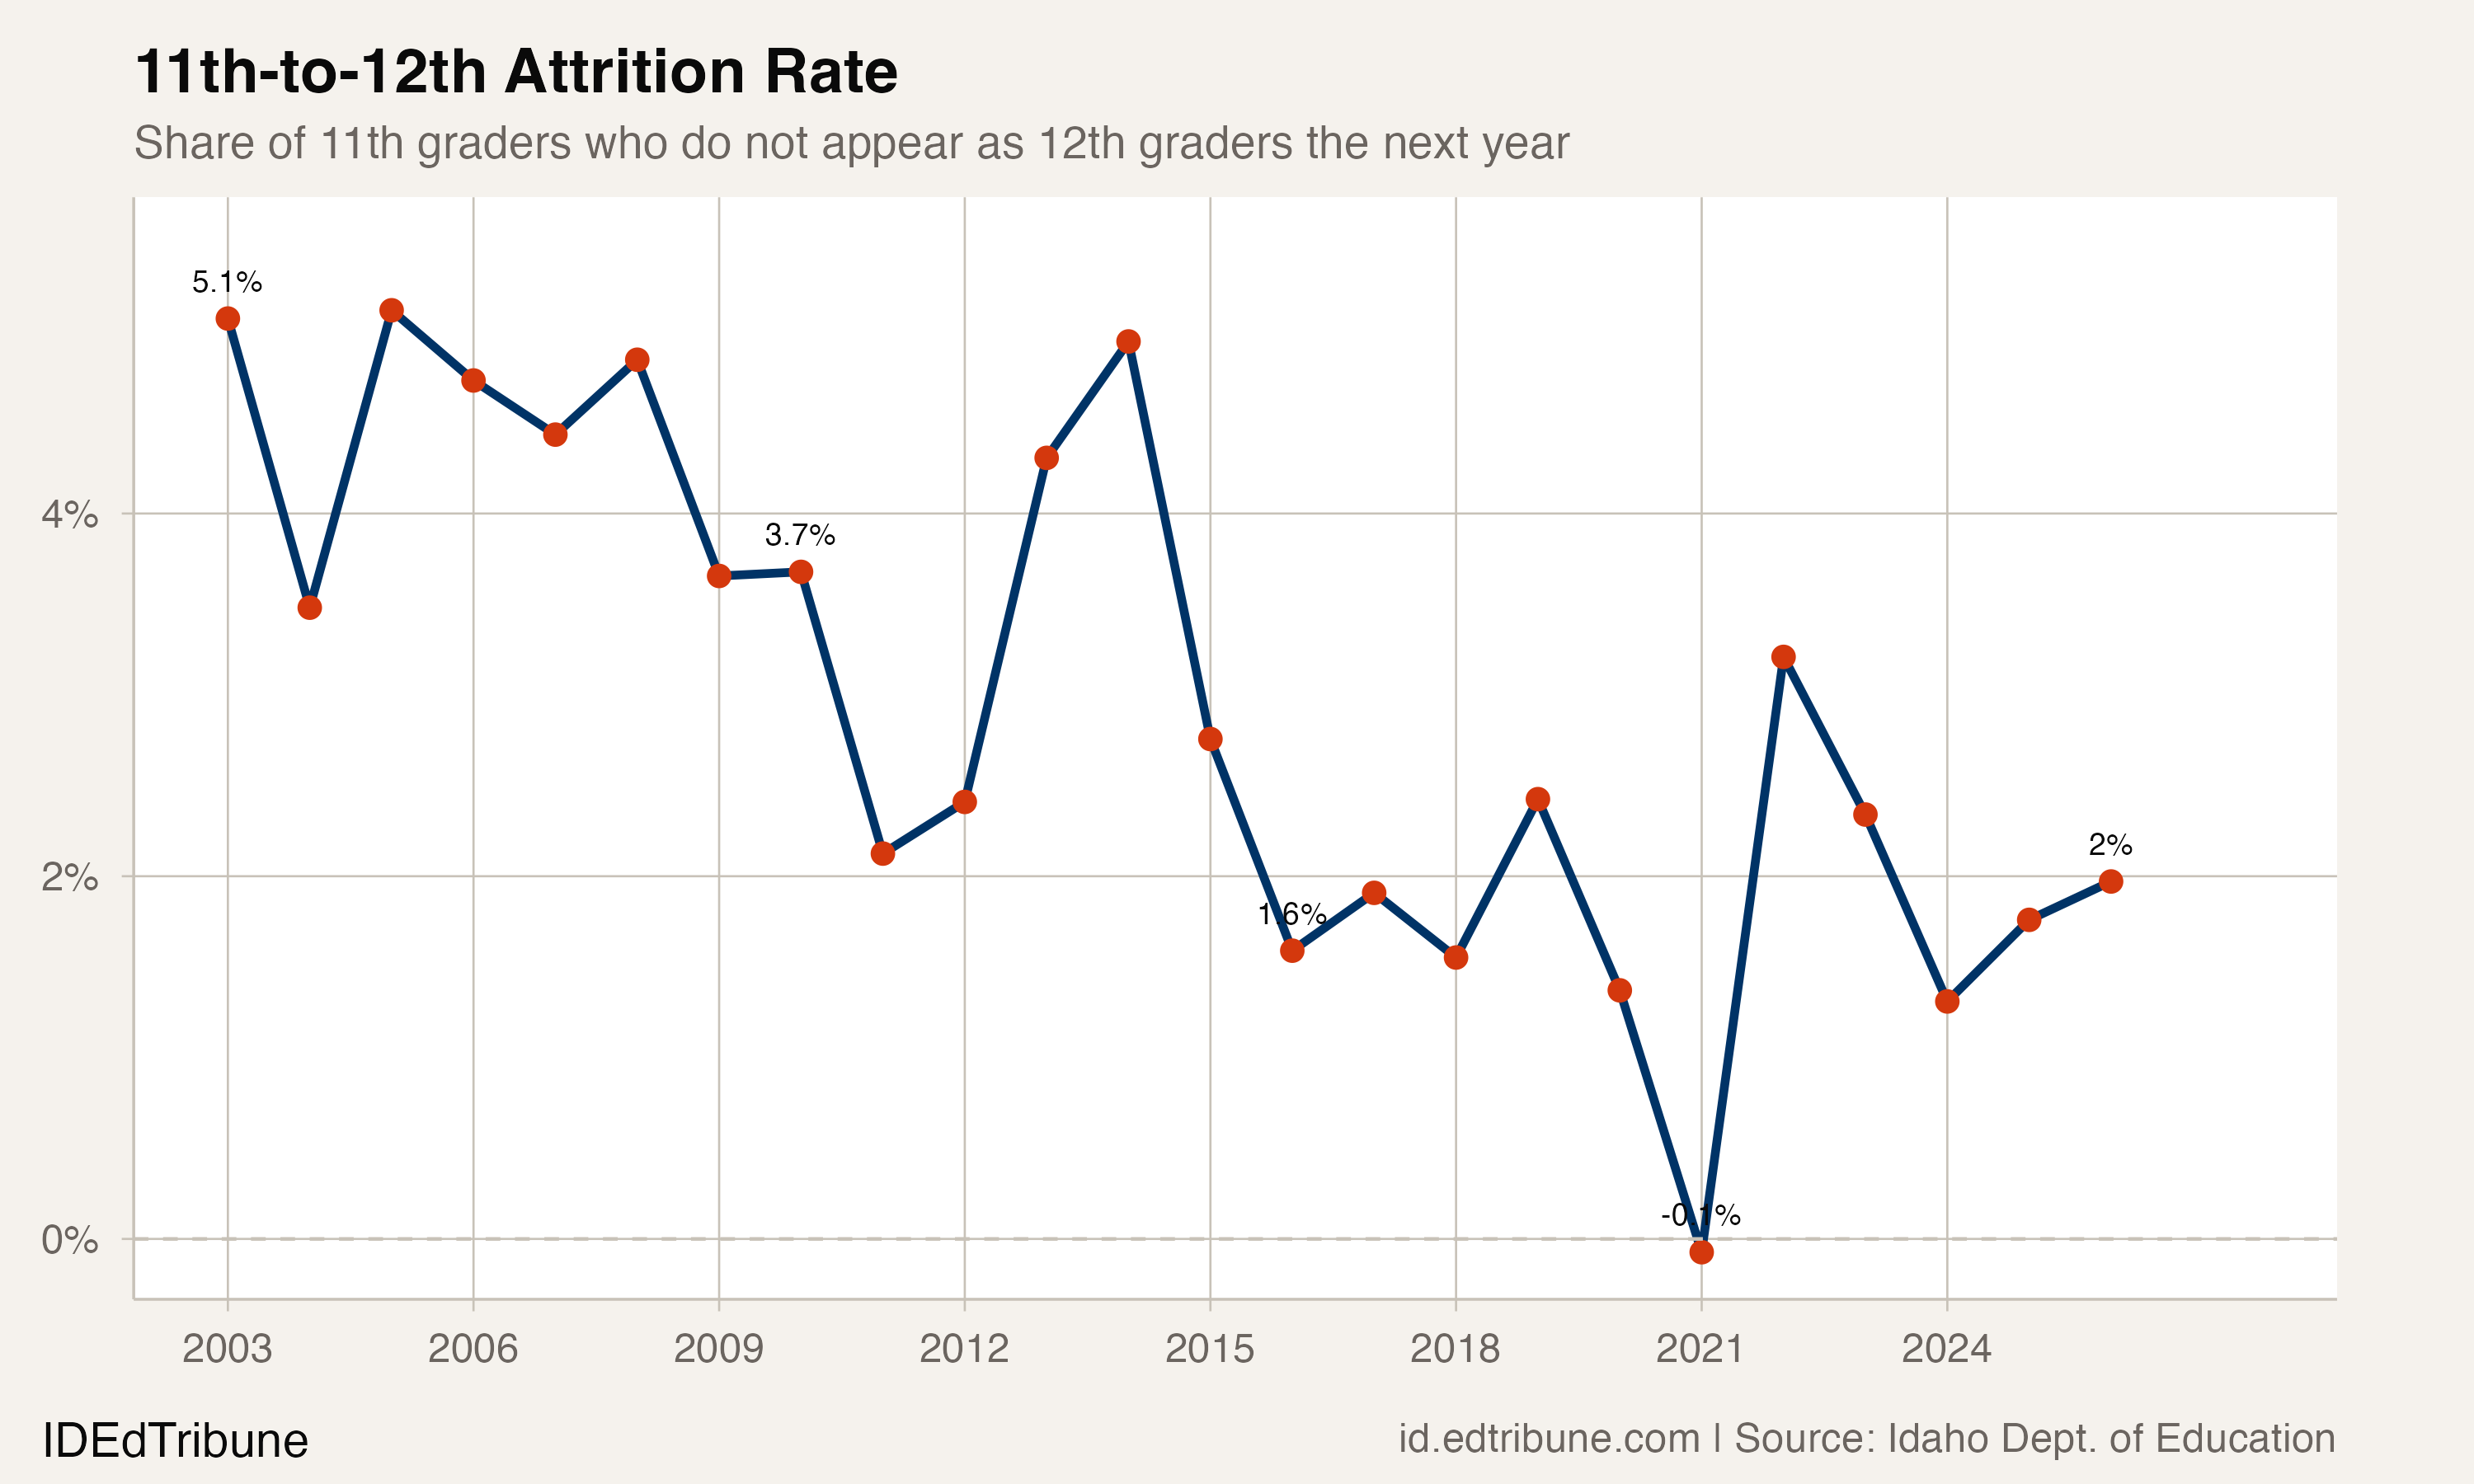
In 2020-21, attrition actually went negative: 23,223 students enrolled in 12th grade that fall, more than the 23,206 who had been 11th graders the previous year. One plausible explanation is fifth-year seniors, students who take an extra year to complete graduation requirements rather than dropping out. Idaho allows students to remain enrolled through age 21, and the state's Advanced Opportunities program funds dual credit, AP exams, and workforce training for students in grades 7-12, giving older students a financial incentive to stay enrolled.
The result is a staircase pattern in grade-level growth. Since 2001-02, kindergarten enrollment grew 13.1%, while 10th grade grew 33.4%, 11th grade grew 36.6%, and 12th grade grew 43.7%. The higher the grade, the more it grew, a pattern consistent with fewer students leaving the system before graduation.
The crossover no one expected
In 2017-18, Idaho's 12th grade enrollment surpassed kindergarten for the first time: 21,571 seniors versus 21,170 kindergartners. The gap has widened every year since. By 2025-26, the senior class outnumbered kindergarten by 5,132 students, with 12th graders at 125.4% of the kindergarten count.
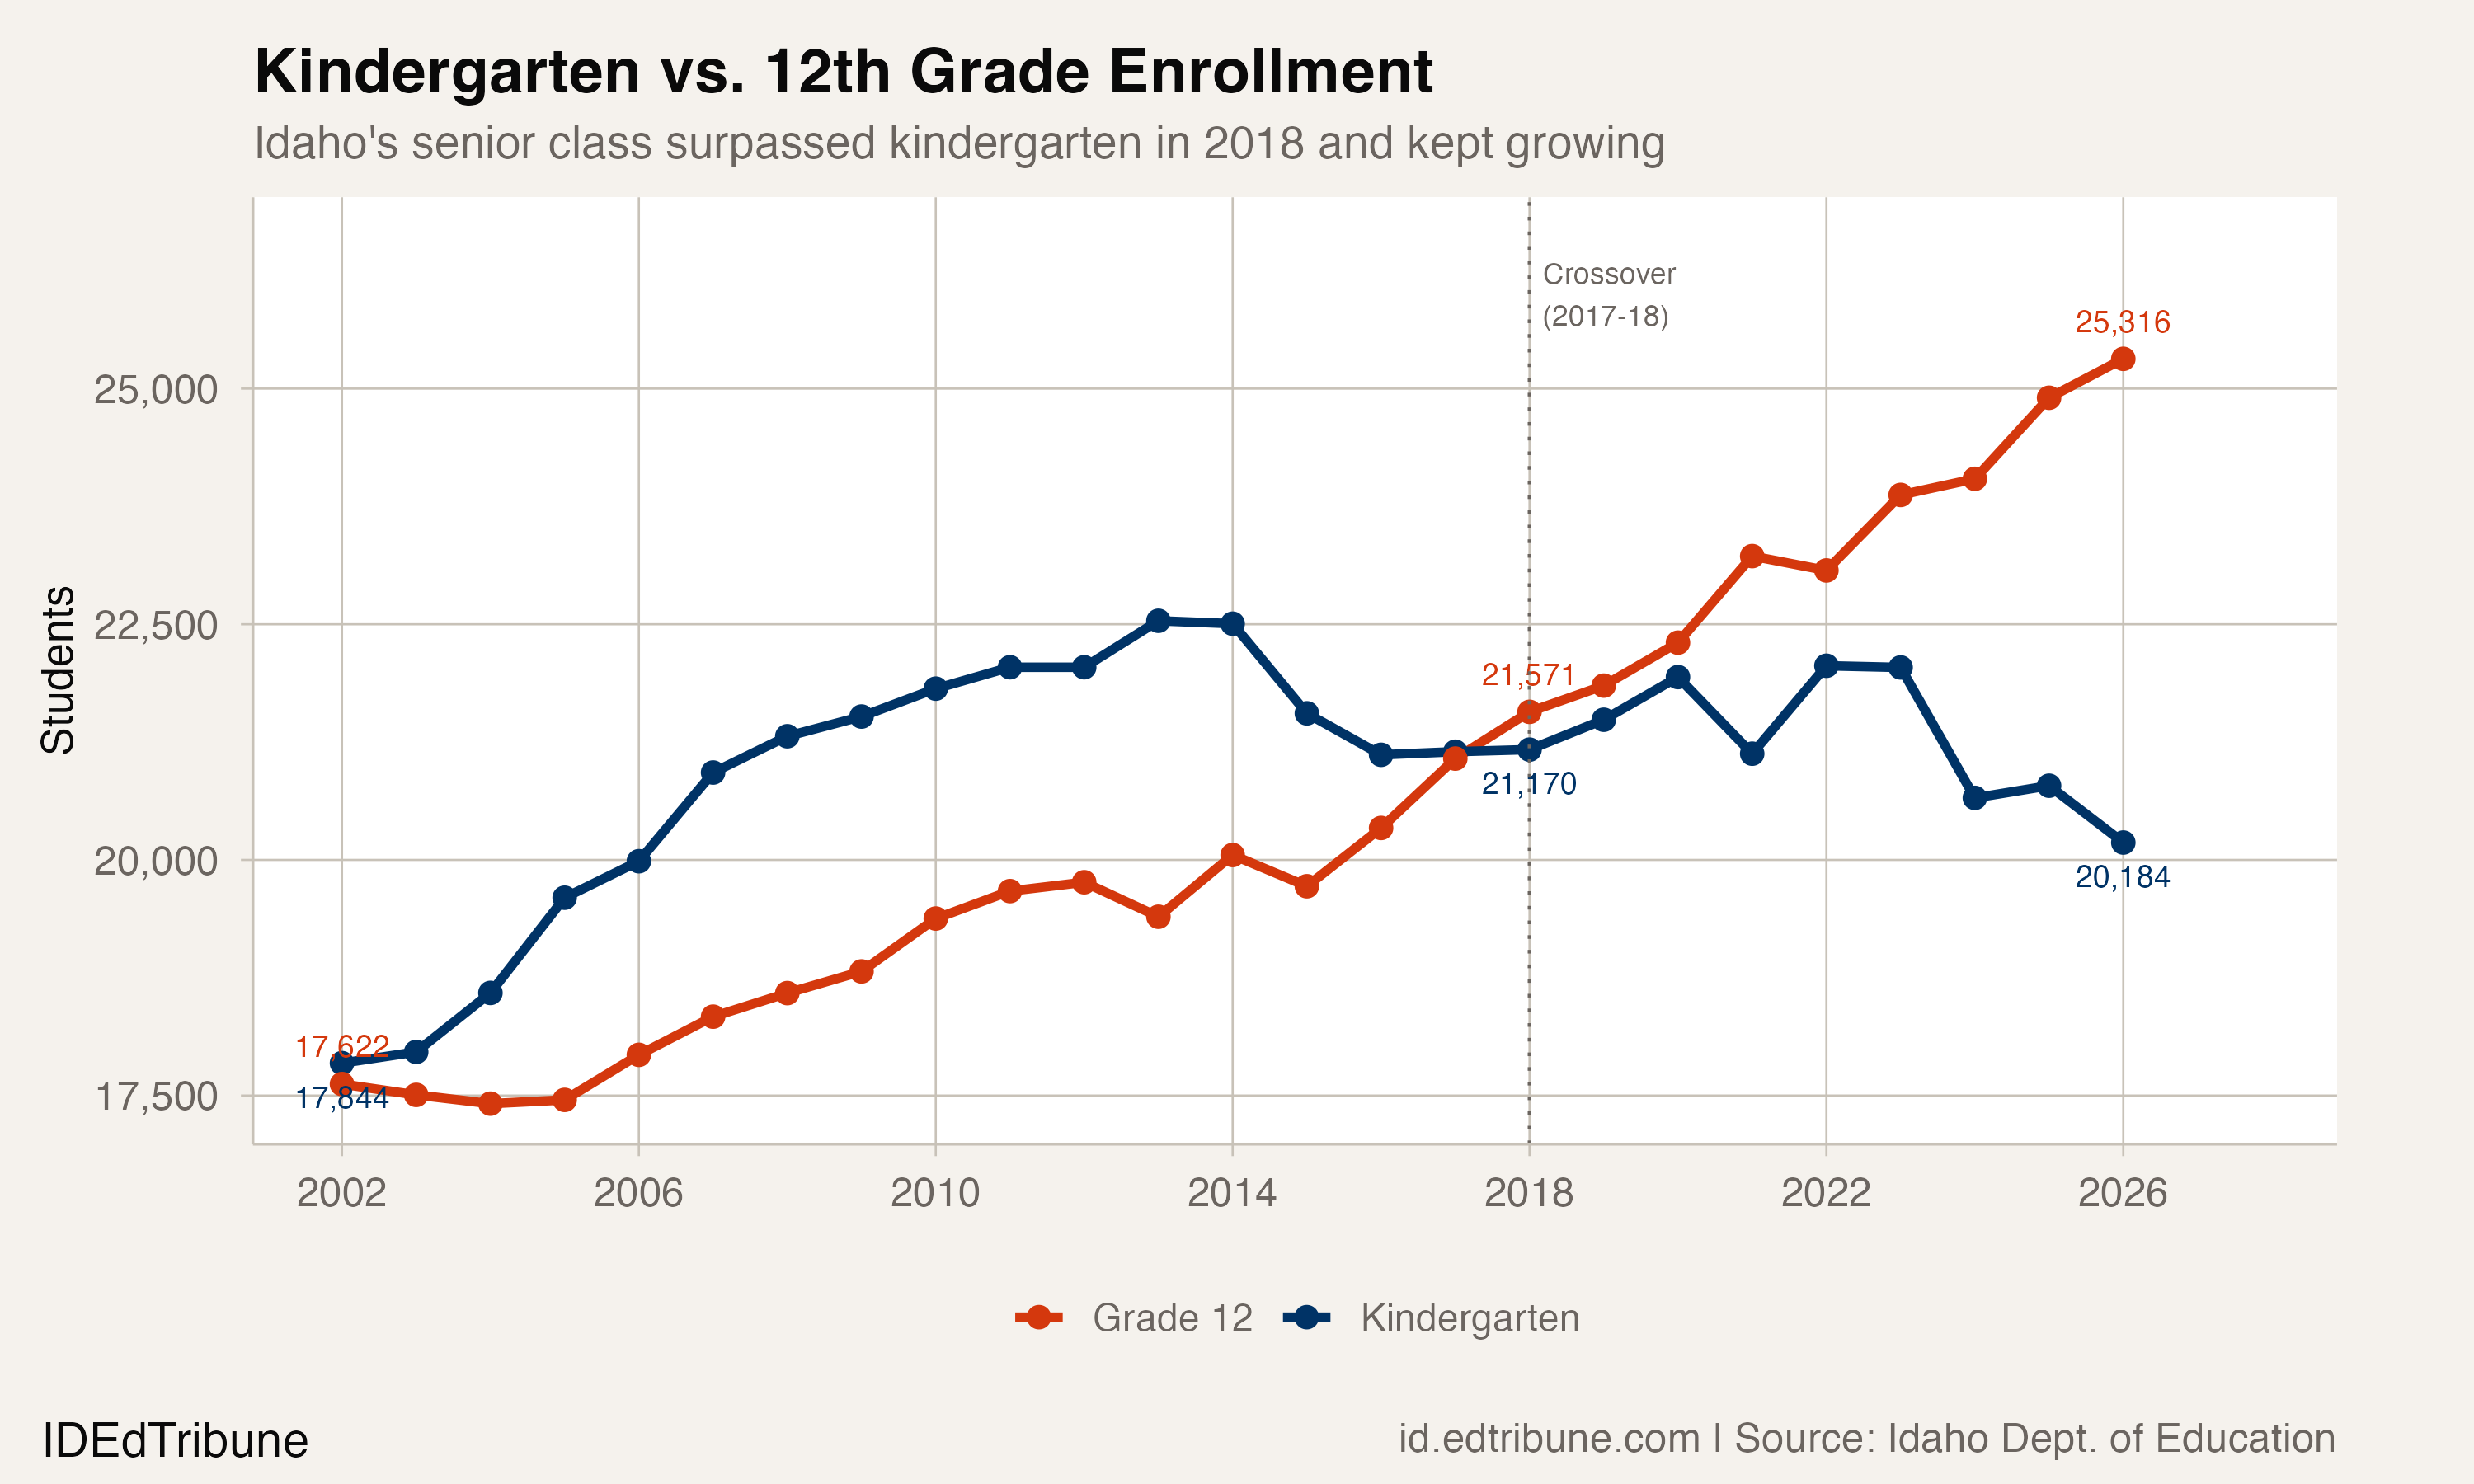
This inversion reflects two simultaneous forces. At the bottom, kindergarten has stagnated as Idaho's birth rate fell 29% between 2007 and 2021, from 16.6 to 11.8 births per 1,000 population. At the top, improved survival keeps more students enrolled through graduation. The combination means Idaho's high school share of total enrollment climbed from 29.2% in 2012-13 to 32.3% in 2025-26, a structural shift that carries budget consequences: high school instruction costs more per pupil than elementary, and the grades demanding the most resources are now the fastest-growing ones.
What credit recovery and online learning changed
Idaho's improvement did not happen in isolation. The Idaho Digital Learning Alliance, the state's supplemental online course provider, grew from roughly 1,500 course enrollments in 2005 to more than 44,000 by 2022-23. IDLA offers credit recovery courses specifically designed for students who failed a class but want to graduate on time, a pathway that barely existed when the 2001-02 freshmen were deciding whether to stay in school.
The state's mastery-based education network, authorized by the legislature, allows participating districts to advance students based on demonstrated competency rather than seat time. For a student who failed algebra but mastered the material over the summer, mastery-based progression offers an alternative to repeating an entire year.
"Moving from the current time-based system to a mastery-based approach will allow for more personalized and differentiated learning." Source: Idaho Code 33-1632, Idaho State Legislature
These structural changes, credit recovery, online coursework, competency-based progression, are the most likely drivers of the declining 9th grade bump. They give struggling students a route forward that does not involve repeating a year and aging into dropout eligibility.
An 82.3% graduation rate still lags the nation
The enrollment survival data tells a more optimistic story than Idaho's official graduation statistics. The state's adjusted cohort graduation rate reached 82.3% for the class of 2024, a 10-year high, but remained flat at 82.3% for the class of 2025. The national average was 87% in 2021-22, the most recent year with comparable federal data.
The gap between a 96.5% survival rate and an 82.3% graduation rate reflects a distinction that matters: survival measures whether a student's body is still in the building, while graduation measures whether they earned a diploma. Students can persist to 12th grade and still fail to graduate on time if they lack credits, fail required exams, or need additional semesters. Idaho's 2025 data showed 4,675 students who started 9th grade but did not graduate within four years, some of whom are the same fifth-year seniors who inflate the survival rate.
For economically disadvantaged students, the graduation rate stood at 74.4% in 2025. For students with disabilities, it was 60.7%. The survival gains are real, but they have not yet translated into proportional graduation gains for all groups.
The plateau and the gap
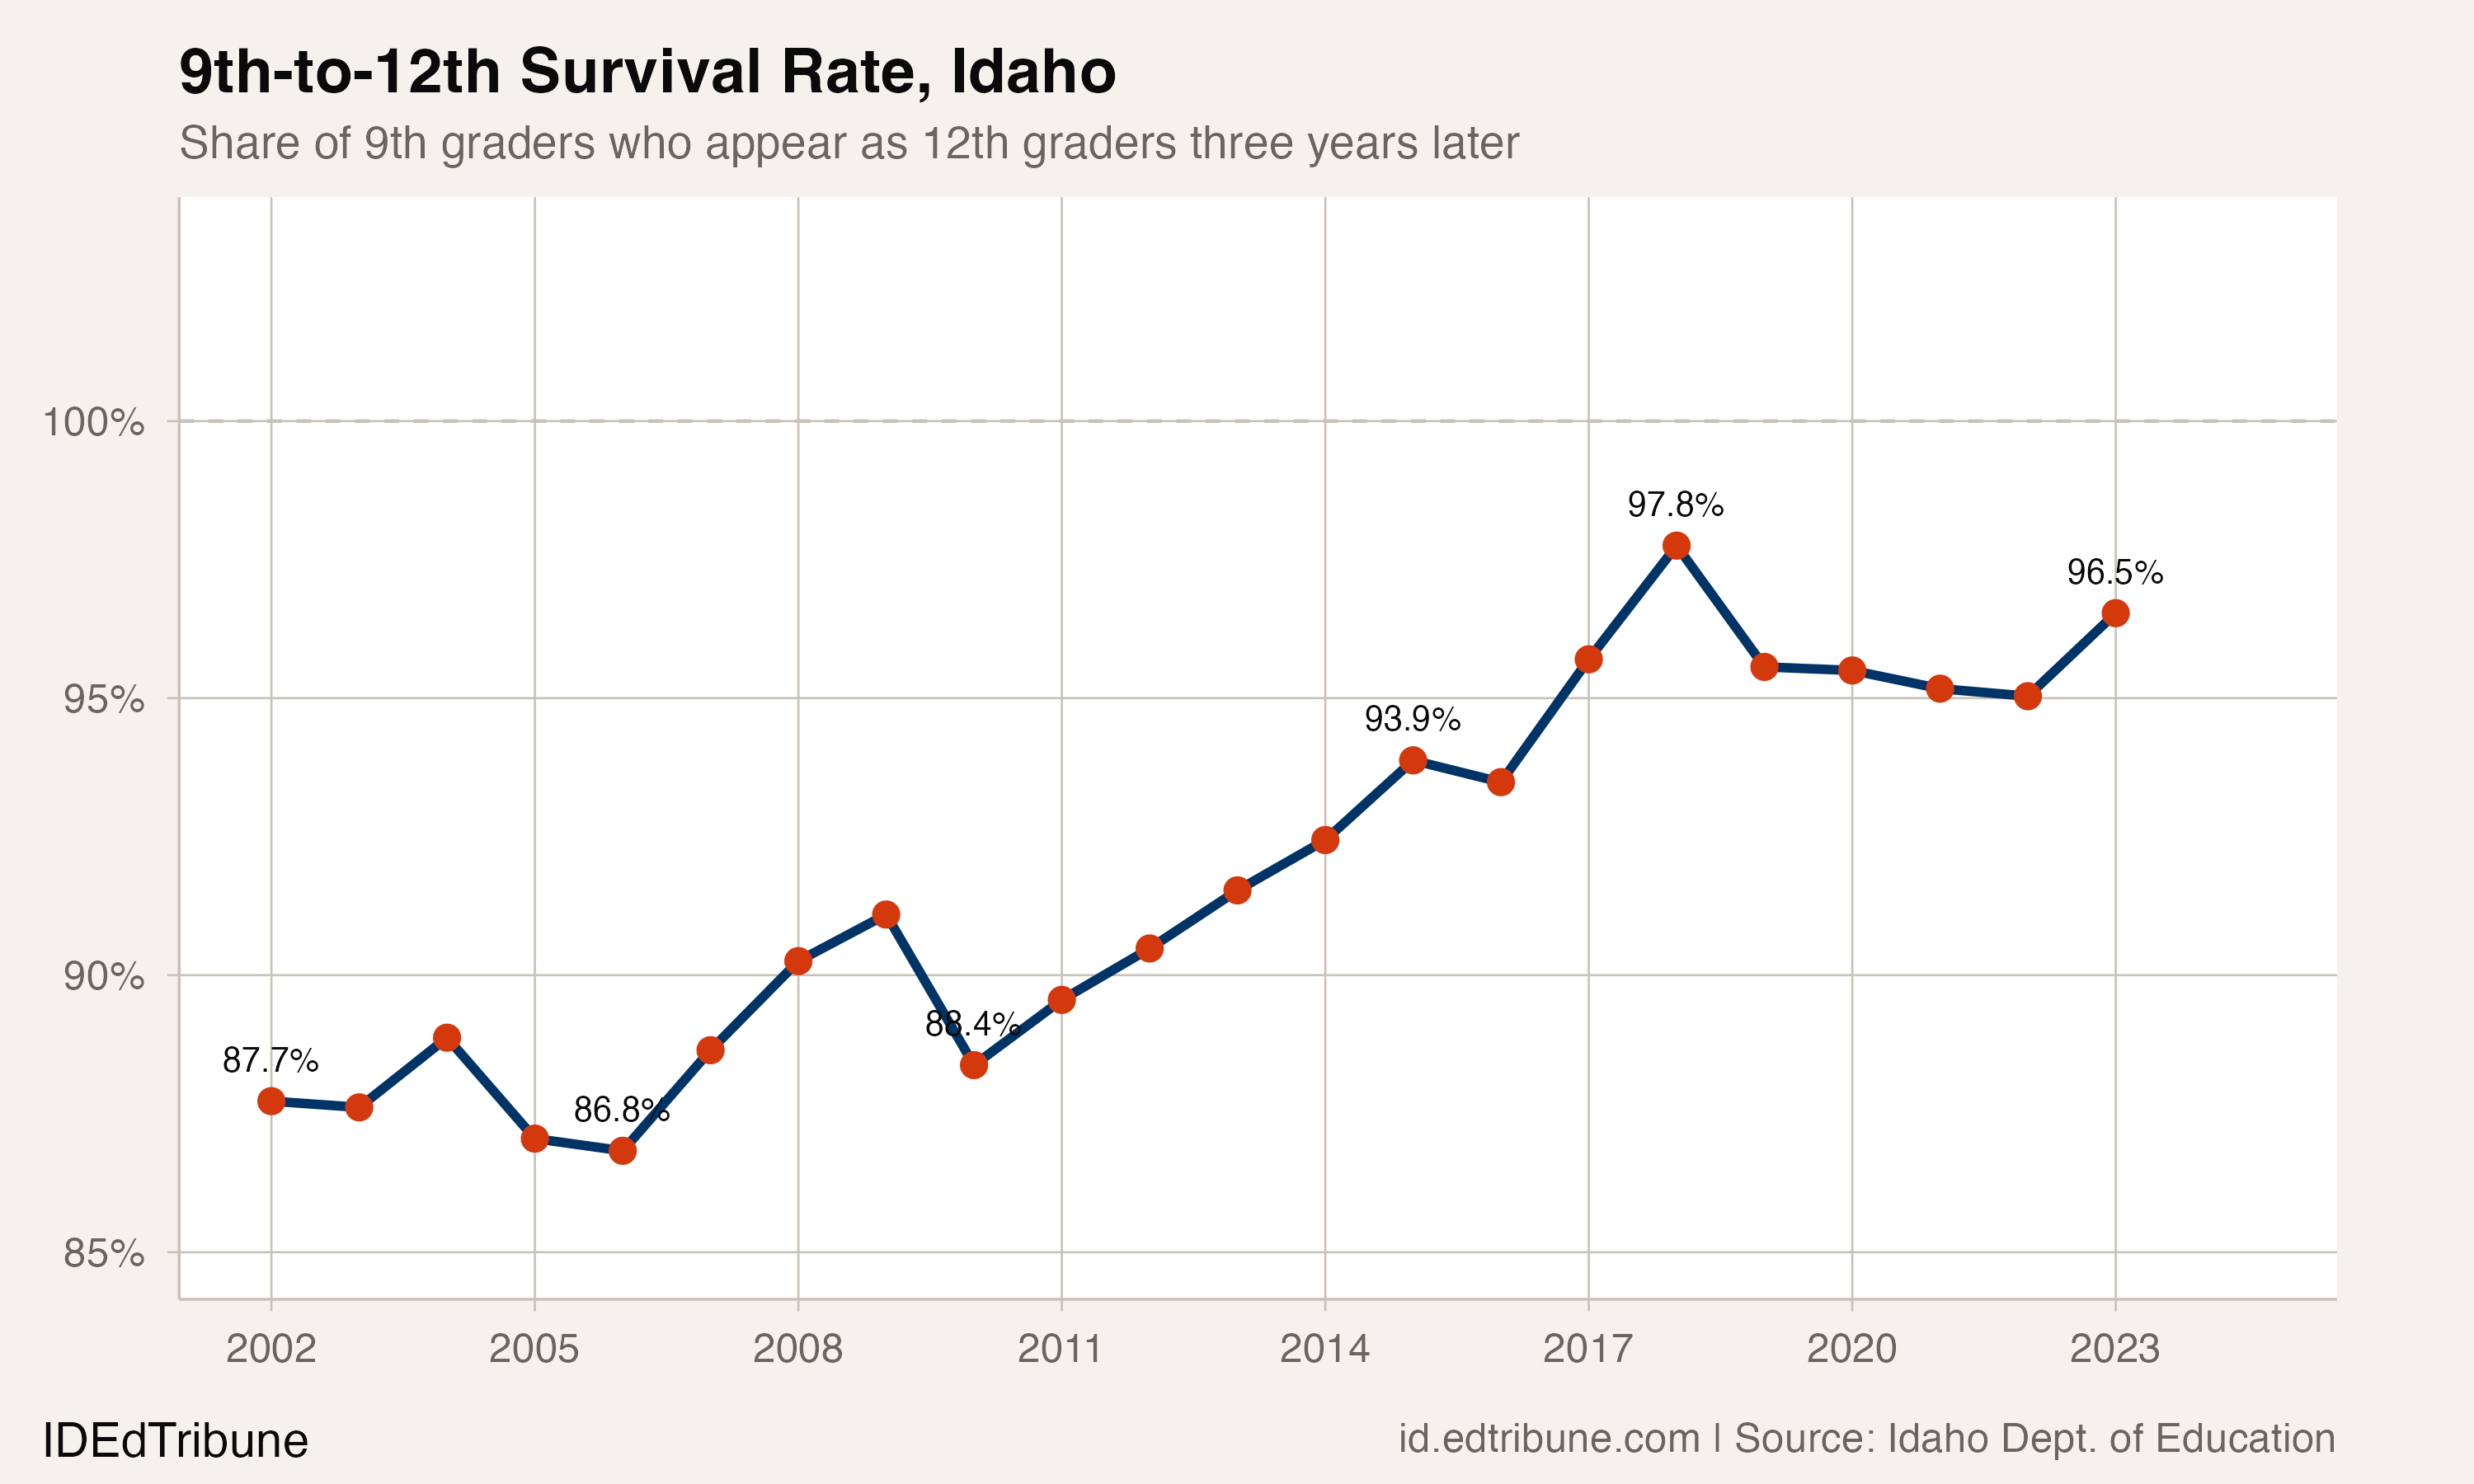
The survival improvement appears to be plateauing. After peaking at 97.8% for the 2017-18 cohort, the rate has hovered between 95.0% and 96.5% for the five most recent cohorts. The easy gains -- credit recovery, online coursework, competency-based progression -- have been captured. The remaining 3% to 4% of students who still disappear before senior year are likely facing challenges that no course catalog can resolve: poverty, disability, housing instability.
And a 96.5% survival rate still produces only an 82.3% graduation rate. That 14-point gap is 4,675 students who made it to 12th grade but did not walk with a diploma. For economically disadvantaged students, the graduation rate is 74.4%. For students with disabilities, 60.7%. Idaho got very good at keeping students in the building. The harder part was always what happened inside it.
Detailed code that reproduces the analysis and figures in this article is available exclusively to EdTribune subscribers.
Discussion
Sign in to join the discussion.
Loading comments...